Waveriders like you and I share a unique relationship with the ocean. The waves we ride give us much pleasure, but also demand much from us. We spend countless hours in the water, and when we're not there it seems we spend equal time thinking about it. Eventually the object of our passion can become a demanding partner. Even when we try and deny her, we are drawn back. The sea can dominate our thoughts and control our lives, it can become an obsession.
But do we really understand what makes the waves we lust after? Do we appreciate the gift that nature freely gives us? It seems knowledge and appreciation come with age. The more you experience, the more you want to know. The more you learn, the greater the appreciation and reverence. It is that knowledge and wisdom that build perspective and maturity. Here we hope to share some of our knowledge so that you can continue to build your own private relationship with the source of energy that gives so much to us.
|
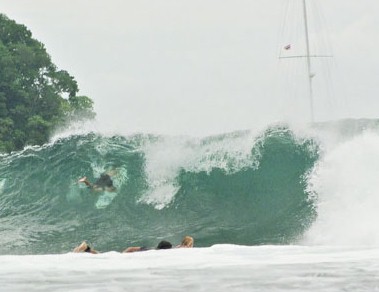
Central America
Photo Courtesy: Joe Trotter |
Today's satellite and modeling technology, in combination with the power of the Internet, provide us an opportunity to learn and know more about what makes the waves we ride than any previous generation of waveriders. Everything you'd possibly want to know is available at the tip of a finger.
These pages are for those ready to step beyond the here and now; to jump forward to a new plane of understanding; to make a leap in appreciation for a sport that can be easily taken for granted.
How are waves made? Imagine a small pond, with no wind blowing on it, just pure calm glassy water. Now toss a pebble into the center of the pond. Once the pebble makes contact with the water, notice that small ripples move out in all directions from the point of impact. The ripples continue traveling away from each other until they encounter land, where they break (if you look real close) and dissipate. There's three things to consider from this example: 1) The ripples have a measurable size or height, 2) They travel towards shore with a measurable speed, and 3) They cover measurable distance that spans from their point of origin until they reach the shore.
After the pond calms down, throw a bigger rock into it. Of course bigger ripples result. Observe that the ripples have a larger height and are moving away from their source faster this time. If you toss yet a bigger rock, bigger and faster waves result. Congratulations, you know all the basics about wave mechanics. But how does this translate into the real-world of open ocean swells? Simple, the ocean is our pond, and a storm is our rock. All the same principles apply, just on a much grander scale. Our pond is now 3000 or more miles wide and our rock is now 500 or more miles wide.
A storm makes waves in much the same way as a rock, it uses mass to move or displace water. Wind can have a tremendous effect on water, especially when it blows for a long time. Waves are made by 'something' causing water to be displaced, and for our purposes, that 'something' is wind.
How does wind make waves? Imagine our little pond again, only this time notice a slight breeze is starting to blow towards you at say maybe at 5-10 nautical miles per hour (kts). It's starting to texture the surface of the pond, nothing really measurable, but texture nonetheless. How is this happening? In short, molecules of moving air, being pushed by the breeze, are rubbing against the surface of the water, causing some water molecules on the surface to move in the same direction as the wind. As a few molecules of water start moving, they collide with others and set them in motion, and as the air keeps moving, so does the water. It's just basic friction.
Now imaging the wind is kicking up a bit more, like say to 20 kts. As would be expected, the water texture turns a bit choppier as more and more molecules are set in motion. Over distance, the little chops start merging to create larger chops. As chops combine, the energy present in each one creates a larger and more energetic chop. The more energy, the faster the chop moves. The little chops have height, and they travel with a measurable speed, and if you could follow an individual one, you could measure the amount of time it takes to travel from one side of the pond to the other. As the wind continues to pick up, now to nearly gale force (34 kts), the chops are starting to whitecap and it starts looking downright stormy. The chops start combining into wind waves and they are bigger and moving faster still, and have more momentum energy associated with them.
But let's consider a real open-ocean storm. Some storms are small in size but have very strong winds, while others are huge in size but have comparatively less wind velocity. Hurricanes are relatively small storms, that is, they rarely exceed more than 500 nautical miles (nmiles) in diameter, but can have maximum sustained wind speeds of over 150 mph over a small area near the center. Conversely, strong winter storms can cover well over a thousand miles but typically have sustained wind speeds of only 50-60 kts. Both are capable of making big wind waves, but not all wind waves are the same.
What distinguishes a good windwave from just a bunch of chop? Ah, now we get to the fun stuff that has real relevance to wave riding sports. Wind waves, though rideable, are not the optimal type of wave one likes to ride. Swells are much better. Wind waves are only the raw material that swells are made from. But, the more energy wind waves accumulate while being driven by wind, the greater the likely-hood they will transform into a swell. Wind waves loose energy and height after they move away from the wind that produces them. What? That's right, wind waves start degenerating once they move away from the wind source that created them, unless enough underlying energy is present to transform the wind wave into a swell. Only if it accumulates enough energy while it's within the influence of the storm will it be able to survive for long once clear of it's source. Not enough energy and it dissipates due to the surface tension of the calm water that it moves through, enough energy and it can travel the entire circumference of the globe with only a slow decay in size!
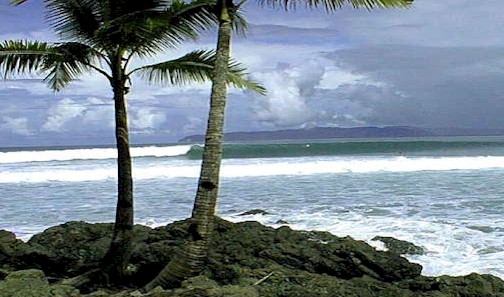 |
Central America
Courtesy: Casey Jones
What conditions are best for making swells? There are three factors that influence the level of energy contained in swells. Wind velocity, wind area (fetch), and duration. That is, the speed of the wind, the amount of ocean surface area affected by wind blowing in the same direction (also known as fetch), and the amount of time those winds blow over the same part of the ocean. Ideally, to make a huge swell, one would want strong steady winds blowing at maximum velocity over thousands of miles in the same direction (fetch aimed towards your beach) for days on end. But, our atmosphere is highly dynamic, and rarely do such conditions exist or persist for long. During a typical open ocean winter storm, one could expect to see winds of 45-55 kts blowing over 600-1000 nmiles for 36 hours. In such a storm, the average highest wind waves (or 'seas') commonly reach 30-35 ft towards the center of the fetch area and produce a swell with a period of 17-20 secs. An interesting point to consider, as the winds in a fetch start to die, say from 50 kts down to 40 kts, they can't add any additional energy to the raw swell produced when the winds were at 50 kts. Instead they can only create new swells of lesser energy. Typically a North Pacific winter storm will start fading from it's max, with a prolonged fetch of 30-35 kts at the end of it's life. The swells produced at this time are not added to the peak swell energy produced when the storm was in it's prime. Instead, this results in production of other swells with lesser energy in the 11- 13 second range, which arrive at a far away beach long after the more energetic ones have hit and died.
OK, so storms make large seas, but how does it actually transform into a swell? As the seas build under a storm, the speed of individual wind waves start accelerating as they combine and merge. The higher the wind velocity and larger the area and longer the time the wind blows, the greater the opportunity wind waves have to combine and grow. Within the storm, waves of many different energy levels are created. Eventually either the storm dies or the wave speed exceeds the forward speed of the storm, and these seas 'escape' into relatively calm waters. But these windwaves are rough, ragged and cover a wide energy spectra. Each individual wave is a mass of chop, bump and unruly un-groomed energy. But these waves have inertia and they're moving forward.
Earlier it was mentioned that chop has little inertia or energy, so it dissipates when traveling distance. This works against swell production when a wind wave has little energy, because it dissipates. But when a wave has lots of time to accumulate energy, this works in its favor. In short, as a wind wave moves away from the storm, the choppy components dissipate, leaving only the pure swell energy to travel. For example, if seas heading towards a shore escaped close to land (say 500 nmiles or so), only some of the bump would have time to dissipate, and a combination of chop and swell energy would hit shore. But if the storm faded 2000 nmiles from shore, all chop would fade and clean swell energy would result (assuming there weren't local winds to create new chop to contaminate the swell). Such swells are known as ground swells. Ground swells from winter storms off New Zealand travel over 6000 nmiles to reach the beaches of South California, groomed clean of chop. (Technically a swell is not classified as a 'ground' swell until it starts to 'feel bottom', normally fairly close to shore. But most surfers consider a ground swell any swell with a period of 13 secs or greater. But more on this later).
Swells that have more energy move faster than those with less energy. Over long distances, the more energetic swells, because they are moving faster, eventually over take and pass slower, less energetic swells. And swells that don't have enough energy, eventually die. So when swells pass a buoy or hit a beach after traveling several thousand miles, the ones with the most energy will arrive first, followed by slower moving ones (perhaps days later). For example, the first waves of a new swell might have a period of 20-25 seconds (secs), followed by 17 sec swells 2 days later, then 14 sec periods and 13 sec periods even days later, and so on. But more on this later.
Velocity, Fetch and Duration
Three factors come together to make huge waves: Wind Velocity, Fetch Area, and Fetch Duration
All are present here as seas in excess of 40 ft are aimed right at the Western US coast.
NOAA Wave Model Courtesy: Scripps Research Institute
Wave Trains, Groups, Sets and Consistency In deep water, as waves move away from the fetch that generated them, they form a continuous chain of swells known as a wave train. Wave trains radiate outward in all direction from the fetch, with the largest waves moving in the same direction as the winds within in the fetch. Over distance and time, waves that are moving at nearly the same speed keep pace with one another and form a group. There can be anywhere from 3-15 or more waves in a group. An interesting thing occurs as the group travels. A group normally consists of smaller waves in the lead, larger waves in the middle, and smaller waves again at the rear of the pack. Waves in the back of the pack move forward and build in size, peaking somewhere in the middle of the pack. When they reach the front, they start getting smaller again, then disappear, only to reappear again at the back of the pack. It becomes impossible to track an individual wave within a group in deep water due to this phenomenon. What is actually happening is rooted in the physics of deep water wave propagation (and is not just limited to ocean waves, but also other naturally occurring waves both in and out of the water). Individual waves in the pack move at twice the speed of the group, but are bound to the group by the energy they share. So though the individual waves move faster than the group, when they reach the front of the pack they get pulled back. It's two steps forward and one step back. Ultimately they only propagate at the group speed (which is half the individual wave speed) in deep water (more on this in a minute).
Another explanation for the disappearing wave theory goes as follows: Groups of similarly paced waves eventually encounter other waves moving at close to the same speed and in the same direction. Minor differences in the speed of individual waves can give an observer the impression that waves in a group disappear. In fact, it is very difficult to track an individual wave in deep water because there are normally multiple wave trains interacting with one another. As one wave train moves 'into-phase' with another (that is, the two wave trains come close to matching each others speed for a short period of time), the height of those waves appears to increase. In essence, the waves move on top or through one another as one wave train overtakes another, giving them false height as they momentarily match speed. As they move out of phase (separate because of difference in speed) the wave height decreases back to normal.
Regardless of the explanation, as groups of waves move further away from their source in deep water (a thousand or more nmiles) the group becomes better defined, with waves of the exact same speed traveling together. If the waves in a wave train have sufficient energy (normally a period equal to or greater than 15 seconds), they can continue with little loss of size or energy, for thousands of miles or until they reach land and break. That's because at these periods (or wavelength) all the energy is traveling deep under the oceans surface, and there's little that can stop it (except for shallow water). A wave with a 14 second period reaches down into the ocean about 516 feet. A 17 second period wave at 761 ft, 20 second at 1053 ft and 25 secs to a whopping 1646 ft! So you can see how little impact an opposing wind wave with a 7 sec period reaching down only 129 ft would have on one of these long period deep water swells. Also, wave groups of different heights and periods can pass right through each other with no effect to each. In fact, other than shallow water or land, the only factor that causes significant decay is the surface tension of the ocean itself. The same tension that allows an insect to carefully walk on water has the long term cumulative ability to slowly sap the height out of a long period swell, but only over thousands of miles. Conversly, a short period swell is much more vulnerable to the affects of surface tension and opposing wind and waves becuase of it relative lack of energy.
Eventually the group starts to encounter shallower water. When this happens the group velocity and the individual wave velocity become the same. As mentioned before, a group can have anywhere from 3-8 or upwards of 15 waves in it. In shallow water, this group is known as a 'set'. If watching the surf, you will occasionally notice a group of waves break that are bigger than the normal background surf. These 'sets' appear as often as every few minutes to once every half hour or more, depending on how far they have traveled to reach your shore. The further the travel time, the better the organization. In shallow water, the in-phase/out of phase phenomenon is no longer applicable. From a surfers perspective, this is good. It would indeed be difficult to catch waves if they disappeared from under you.
Now it's time for a little math. The speed (in nautical miles per hour or kts) of an individual deep water wave is about 3 times it's period (in seconds). That is, an individual wave with a 13 second period travels at 39 kts. Contrary to what you might intuitively think, there is a linear relationship between wave period and wave speed. But because most deep water waves move in groups, the group speed is half that of an individual wave (within the group), or in this example about 19.5 kts. As the wave moves into shallow water, the group speed and the individual wave speed become the same, so the individual wave starts traveling at the group speed, or 19.5 kts. This wave speed formula is approximate, and actually wave speeds are a fraction different, but this is close enough for all but the most detailed surf forecaster.
With this knowledge we can begin to understand the nature of sets, and what governs their frequency at your beach. As mentioned earlier, the further away the swell source (fetch), the better the opportunity for the deepwater group to organize. Since groups are really a collection of individual waves moving at the same period, we can begin to understand why there is so much time between sets that travel a long distance. Consider a summer swell that reaches California and was generated 6000 nmiles away near New Zealand. Assume that two groups were generated at nearly the same time, one with a period of 17 secs, and another at 16.95 secs. That's right, only .05 secs difference. The 17 sec period group would take 226.24 hours to reach the coast, while the 16.95 sec group would take 226.91 hours, or a difference of .67 of an hour (40 minutes). Considering that 20-30 minutes is the standard 'wait-time' for southern hemi swells in California, you can see how this example is not too far off the mark. Each set is just a small fraction of a second shorter in period than it's predecessor. Now if the storm was a bit closer to the coast, say 4500 nmiles, then the travel time would be 169.68 hrs and 170.18 hrs respectively for the 17 and 16.95 sec period groups, or a difference of .5 of and hour or 30 minutes between sets. As the fetch moves closer to the coast, the wait time between sets progressively decreases. This holds true up to a point were the fetch gets too close to the shore, somewhere in the 1000 nmile mark.
Now not all beaches have access to a thousand or more nmiles of exposed ocean, and even on coasts that do have such access, storms may form close to shore. In these conditions, sets (of sorts) still occur, but on a much less organized scale. Because the individual waves haven't have time and distance to organize into well defined groups of waves moving at the same speed, the sets have fewer waves in them, typically from one to three. And the sets don't arrive a the coast arranged with the most energetic wave first, but rather a mix of short and longer period waves jumbled together. If fact, these sets really aren't sets at all in the classical sense, but are really just a wave or two that are larger than the average. This could be due to a combination of any number of factors coming together at the same time and place to make a grouping of larger than average waves. It could be that a just a few waves of nearly equal speed arrive at the coast at the same time but haven't traveled sufficient distance or had time to be joined by many more waves (like classical set theory), or that waves of different periods are overtaking one another just at the point where they are interacting with land (modified rogue wave theory), or that a real swell from far off is arriving but buried under locally generated wind waves creating the impression of a local set. Or two groundswells or windswells from different directions are interacting to produce peaks. All these conditions can and do occur, which often makes it difficult to know exactly what swell you are riding and where it came from.
Previously 'fetch' was defined as the amount/distance of ocean surface area affected by winds blowing in the same direction. One might presume that a storm sits relatively stationary over fixed area of the ocean, blowing up chop and waves equally in all directions. But, in reality, most large storms (other than hurricanes) typically follow the jet-stream, taking a course from west to east at anywhere from 20-30+ kts. In some instances, a storm's forward speed comes close to matching the speed of the waves it's generating. This allows progressively more chop (and energy) to start piling up on top of wind waves generated earlier in the storms lifecycle (providing the waves are traveling in the same direction the storms is heading). The wind waves aren’t given the chance to escape, but rather, build up to tremendous heights averaging 50 or more feet. Though a storm might have only 700 nmiles of proper fetch, if the storm travels 2,000 miles over several days heading in a constant direction at the right speed, the effective fetch area is 2000+ nmiles. That's the equivalent of 2000+ nmiles of core fetch over a multi-day period aimed at someone's beach! There are tables that predict wave heights and period based on wind speed and fetch, but by any standard, such a situation is sure to create huge swells. When this situation occurs, it's called 'traveling fetch'. Traveling fetch is as much bound by meteorology as it is by simple geography. There are only a few west facing locations in the world which are bordered by several thousand miles of open ocean and positioned near the tracks taken by winter storms. Such locations include the Northwest United States, Western Australia, Chile/Peru and to a lesser extent Southern Europe. Hurricanes can create traveling fetch too, but since their fetch area is typically much smaller, the effect is less pronounced. Because some level of traveling fetch occurs in most every storm, this explains why the largest waves come from the front of the storm, and smaller or no waves come from the sides and back of a storm.
But within the domain of traveling fetches, there is a category we call 'virtual fetch'. It is a special type of traveling fetch that is identified only by running the swell arrival calculations. When the fetch travels directly at a beach at just the right speed such that the swell it generates over multiple 12 hour intervals arrives a nearly the same time for a given frequency (period), then we call the fetch a 'virtual fetch'. That is if the 17 second period swell generated from a storm on say Saturday a 5 AM, 5 PM and Sunday 5 AM all is expected to arrive a location X on Tuesday at noon, then we say the storm produced virtual fetch.
But what does virtual fetch have to do with sets? Well not every swell generated from over a thousand miles away produces sets with 10 or more waves. It is really a factor of the internal organization of the storm that generates the swells and it's propensity to generate virtual fetch. The better the internal organization and more virtual fetch, the greater the potential to generate sets that contain a large number of waves. For swells generated over the North Pacific that impact the US west coast, it is not uncommon for a set to contain upwards of 15 waves. Such swells can be traced directly to the storms capacity for generating virtual fetch.
What common units of measure are applied to open ocean waves? There are two attributes used to measure open ocean waves: Height and Period. Wave height is the distance from a wave's trough to its crest (i.e. amplitude). The crest is the top of an unbroken wave, the trough is at the bottom of the front of the wave. Wave period is the amount of time (in seconds) it takes from the moment one wave crest passes a fixed point until a second wave crest passes that same point. Typically one will hear waves described like, " It's 5 ft @ 13 seconds". What this means is that the average height of the largest 33% of the waves are 5 ft and that the average period (time between wave crests) of the most prevalent swell is 13 seconds. But waves measurements come in two flavors: Significant Seas and Swell. In general, if you have a choice between obtaining Significant Sea or Swell data, use Swell data. Significant Seas don’t exist in the real world from a surfing perspective. "Seas" are the combined sum of the heights of all waves present at the reporting station. Think of it as the average wave size. For example, it there is a 5 ft swell coming from the north, and a 3 ft swell coming from the south, it would be reported as a 6 ft sea. ('Seas' are actually the square root of the sum of the squares of all wave energy present). Add in a bunch of open-ocean chop and it really starts to skew the results. Surfers don't typically ride two separate waves coming from two different directions simultaneously. So the seas measurement is actually overstates actual wave size.
But if you're in a boat at sea, significant sea heights are very important. They help set an expectation concerning the size of waves you might encounter. If you're in or near a major fetch area (a storm), waves of different heights and period momentarily combine as they pass through each other to form larger waves. It makes no difference whether it's chop or swell. On average, about 15% of waves will equal or exceed the significant wave height. The highest 10% of waves could be 25-30% higher than the significant wave height. And on occasion (about one per hour) one can expect to see a wave nearly twice the significant wave height. And then there are rogue waves, those that exceed twice the significant wave height. For example, in 1933 the USS Ramapo reported encountering a record 112 ft wave. On September 6th 1995, the ship Teal Arrow was in the center of Hurricane Luis where central pressure was measured at 942 mbs. The ship reported sustained winds of 64 kts and later at 99 kts. Gust were 125 kts and wave heights to 50 ft were reported. But on September 11th, during the same hurricane, the Queen Elizabeth 2 (QE2) hit a 95 ft wave 200 nmiles south of eastern Newfoundland and 120 nmiles southeast of Luis's center. In these cases the large waves were probably the result of 2 large waves traveling at about the same speed/period momentarily combining to form one giant wave. In 1995, the QE2 was reporting significant seas of 46 ft and winds were sustained at 80 kts with gusts over 100 kts. A nearby Canadian buoy reported peak waves of 98 ft at about the same time. Clearly they were in the middle of a storm. Statistically, one would have expected the QE2 to encounter about 1 wave twice the significant sea height once per hour (46 ft x 2 = 92 ft). It is theorized that such waves don’t last for more than a minute or so, as slight differences in speed cause them to separate. And once seas escape their source, and start to travel long distances, these raw wind waves start getting groomed into swells, and their highly variable character fades. On average, most boaters encounter waves that are only about 65% the height of the reported significant sea, since most avoid storms for obvious reasons.
From a surfing perspective, rogue waves are far from the norm, since surfing is near impossible in winds over 25 kts. Perhaps the largest wave a surfer will ever encounter on any particular day is that which is reported as the significant sea height. This happens when a ground swell and a locally generated wind wave coming from the same direction converge. But swells have more energy, and are easier to catch, so they will be what most of us ride. If both a swell and reasonably long period wind waves are present, then the upper limit one might experience could approach the significant sea height. Surfers and boaters notoriously overestimate the size of the waves they encounter, and statistically, significant sea measurements help sustain that practice. But, a far better measure of unbroken waves is the Swell height and period. Swell height is the 'average' height of the highest 1/3 of the most energetic swells present at that reporting station (a buoy), and is most likely what one would ride if surfing near that location. Likewise, swell period is the average period of the most energetic swells. Use swell data whenever possible.
Chop tends to have a period ranging from 3-8 seconds. That is, there is anywhere from 3-8 seconds between each wave crest. Wind waves range from 9-12 seconds. Ground swells range from 13-15 seconds, and strong ground swells have a period anywhere from 16-25 or more seconds. The next time you're in the water, try measuring the amount of time between wave crests. Though shallow water tends to distort the times as compared to what you'll see reported at buoys, the comparative effect is still the same. What you should find is that on days where the surf seems weak, the period will be short. And on days where waves of equivalent height seem strong, the period will be longer. You should also find that on long period swells, it seems like a lot more water is moving around as compared to shorter period swells of the same height. That's because it is! Longer period swells have a lot more energy and are moving a lot faster than their short period counterparts, and so there's a lot more water movement. A 3 foot swell with an 8 second period moves at about 12.48 nautical miles per hour. But the same 3 foot swell with a 22 second period moves at about 34.32 nautical miles per hour. That’s almost 3 times as fast! And moreso, the longer the period, the larger the wave will be when it breaks (all other things being equal). That's because a longer period swell affects water much deeper in the ocean than short period swells. Long period waves move faster and deeper. In short, swell period is more important than height. Also, swell speed is directly proportional to its period. It's a linear relationship. As period increases so does swell speed. And all swells of the same period travel at the same speed, regardless of size. That's right. A 2 ft swell with a 20 sec period moves the same speed as a 25 ft swell with a 20 sec period. If you can predict the period of a forecasted swell, and know how far away the storm is from your location (in nautical miles), you can accurately determine the arrival time of the swell, regardless of it's size.
You've also undoubtedly noticed that swells come from different directions. Some swells come from the north, others from the south, depending on the time of year and location of your beach. Swells and waves are directional, that is, they originate from different locations and arrive at your beach from different angles. The angle a swell originates from relative to a fixed location (your beach) is called swell direction or swell angle. Swells coming to you beach from due north (and are therefore heading south) are said to be coming from 0 degrees. Swells coming from due east and heading due west are coming from 90 degrees. Swells originating from due south and heading north are coming from 180 degrees, and so on around the 360 degree compass. Likewise, if you know where a storm is located relative to your beach, and you know that storm has fetch aimed in your direction, then you can estimate what the swell direction will be when it hits. If the fetch area in the storm is located due north of you, the swell will come from 0 degrees. If it's located due east of you, then the swell will come from 90 degrees, and so on.
Swells travel away from their source on Great Circle paths or routes. A Great Circle path is the shortest distance between two locations on a spherical object, like our planet. Surf forecasters use great circle paths to determine whether fetch (wind) is blowing towards your beach. One end of the path is your beach, and the other is located at the center of a suspected swell generating fetch area. If sufficient wind is blowing down (parallel) to a great circle path that ends unobstructed at your beach, then a swell could result. Winds blowing less directly down that path result in smaller swells. Typically, swell size decreases to 85% of it's potential if the wind in a fetch area is blowing 30 degrees off axis (non-parallel). Use QuikSCAT satellite imagery to verify whether fetch is blowing down a path that ends at your beach. For distances less than 500 nmiles, the great circle paths to your beach are generally a straight line. But for distances greater than 500 nmiles, the curve of a great circle path becomes important. Great circles are also used to mark the edges or boundaries of a swell window. Click here to see great circle paths for many breaks around the world.
 |
Great Circle Paths
Here is a sample of the great circle paths from the South Pacific and Indian Oceans to Southern California. The great circle paths are the black lines that radiate out from Southern California. If winds (within a storm that is positioned on these paths) are blowing parallel to the paths, then the swell these winds produce will travel right down the path to the California coast. Also notice how the paths converge again in the Indian Ocean, exactly half way around the planet. It would take a tremendous storm to produce waves that would actually be measurable by the time they reached the California coast, but theoretically it is possible.
Great circles are the line that results on the surface of a sphere when you pass any plane through that sphere so that the plane intersects the sphere's center. In layman's terms, it's the path that results when you try and draw a true straight line on a globe. Rather than using globes, meteorologist and surf forecasters use maps to view the surface of the earth. When you take a sphere (a 3 dimensional object) and try to flatten it out to two dimensions (like a map or computer image), distortion results. There are many types of map projections and each attempts to deal with this distortion in different ways. The most common map is the Mercator projection, but it grossly exaggerates surface area towards the poles. This results in Greenland looking to be as large as the continental United States, when in reality it is about one third as large. When looking at great circle charts, map distortion exaggerates the natural curve of great circles, especially over long distances towards the poles.
Great circles paths tend to curve towards the poles, and for a good reason. That's because the shortest distance between two points on a globe is not a straight line. This phenomenon become really pronounced over longer distances. Say you want to map the shortest course from Orlando Florida to London England. Your natural inclination would be to draw a freehand straight line between Orlando and London. But if you use the straight edge of a piece of paper as a guide, you'd soon find that it was nearly impossible to recreate the freehand line you drew previously. Every time you pull the paper tight between the two endpoints, the paper starts creeping to the north. The resulting track ultimately starts creeping over Newfoundland, almost 300 nmiles north of your freehand track. If you were to measure the two tracks, you'd also find the northern most route was the shortest. That path is the great circle path.
Obviously waves that encounter land or shallow water break and dissipate. So, for a wave to reach your beach, it must be able to propagate unobstructed from it's source (a storm) to you, without encountering a continent, island, isthmus, point, or shallow underwater shelf. Even land masses a thousand miles away can have a significant impact on arriving swells. The set of compass headings or great circle paths that provide unobstructed swell access to your beach is know as your 'swell window'. Each beach or break has a different swell window. For example, Cocoa Beach, Florida is bound on the north by Cape Canaveral and Cape Hatteras, North Carolina. It is also constrained from the south by the Bahama Islands. The effective swell window for this location is about 31 degrees through about 115 degrees south. Any storms that have sufficient fetch aimed at Cocoa Beach, and are positioned within that 'window' of great circle paths, have the potential to generate surf there.
So far we've discussed only individual swells from a single source. But in reality, any beach can experience multiple swells coming from multiple directions simultaneously. If you were to observe and catalog all the waves passing a fixed point anywhere in the ocean, during a 10 minute time period, you might find a large variety of waves present. A few waves might be coming from 180 degrees with a height of 1-1.5 feet and periods ranging from 15-18 seconds. Many others might come from 270 degrees with a height of 4-5 feet and periods ranging from 10-13 seconds. And yet others from 310 degrees with a heights of 5-6 inches and periods from 4-8 seconds.
A Directional Spectrum image depicts the period, direction and density of all waves present at a fixed location for a preset period of time. Spectral analysis data is produced from buoys that have height, period and directional sensors installed. The output from these buoys is very useful for getting a quick yet comprehensive analysis of the sea conditions at the buoys location. Unfortunately, such buoys are relatively rare.
Directional Spectrum
Notice a weak wind swell at 11 secs from 305 degrees, with even less period chop from the same angle.
Also some weak energy at 13 secs coming from 165 degrees (most likely an anomaly).
Image Courtesy: Coastal Data Information Program
But earlier we mentioned wave density or spectral density. What is spectral density? It is an image that identifies the relative wave energy present at all frequency/periods at a fixed location for a predefined time period, regardless of the energy's directional heading. Though wave density charts don’t show direction, they provide a good image of what period bands have the most energetic waves. And of greater interest, operational buoys with this capability are fairly common. If you are expecting arrival of a high energy swell, and there is lot's of low energy 'noise' wind waves present, monitoring wave density or spectral analysis data can provide early signs of the swells initial arrival.
 |
Spectral Density
The Spectral Density image depicts all the energy present in each wave period range. Notice most energy is concentrated at the 15-17 sec range, but chop energy is present down to 4 seconds, and very powerful groundswell energy is present from 17 secs out to 25+ secs.
Image Courtesy: National Data Buoy Center
It's matter of experience and choice as to what size, period, and swell direction each of us prefers, but if you know what the swell conditions are before you set foot in the water, you'll be a lot better prepared.
Much more explanation about buoy measurements and how this translates into a breaking wave face heights can be obtained here.
NEXT |