El Nino and La Nina can have profound effects on global weather and ocean conditions. Under normal conditions, trade winds on the equatorial Pacific normally blow from east to west (Peru towards Asia). This causes the warm waters of the equatorial Pacific to migrate toward Asia, and cool water to upwell off Peru. Generally, high pressure builds over the cool Pacific waters off Peru producing stable atmospheric conditions while low pressure and tropical precipitation develops off Asia.
Under El Nino conditions, the trade winds reverse direction, blowing from west to east (Asia towards Peru). The warm waters off Asia start migrating across the tropical Pacific towards Peru, and the waters cool off Asia. Typically the cycle starts in early summer and the warmest waters reach Peru right around Christmas. Drought sets in over Asia as high pressure builds over the cooler ocean waters, and flooding occurs over the east Pacific as low pressure moves in. Precipitation follows the warmer waters across the Pacific.
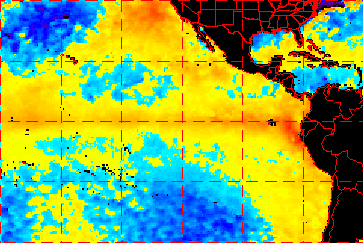
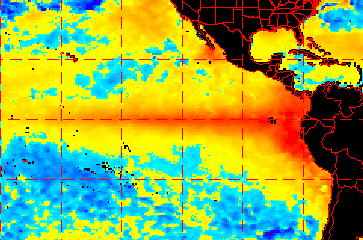
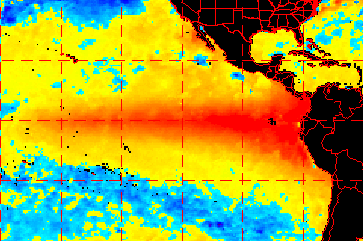
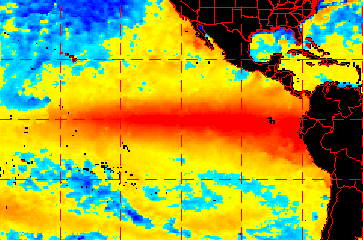
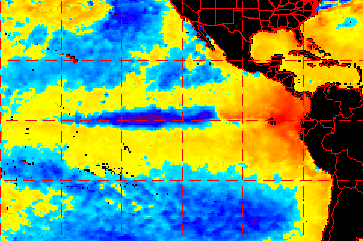
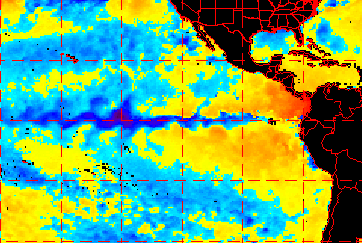
Evolution of 'El Nino'
Sea Surface Temperature (SST) anomalies on 5/12/97, 7/5/97, 10/11/97, & 12/6/97
(Red depicts warmer than normal SST's, blue colder than normal. Warm water slowly builds up along the Peruvian coast as surface winds reverse direction and blow warm water from west to east along the equatorial Pacific. The maximum areal coverage of surface warm water is reached in December '97, when El Nino reaches it's peak. .)
Images Courtesy: NOAA NESDIS
Kelvin waves often signal the start of an El Nino cycle. Eastward propagating Kelvin waves are driven by the Madden-Julian Oscillation (MJO), a cyclical weather pattern with duration of 30-60 days per cycle. The MJO is characterized by a weak low pressure center that develops in the east Indian Ocean and tracks eastward along the equator, against the normal flow of tropical systems. It can propagate into the North Pacific as far east as the dateline. The MJO has been implicated in the development of the wet winter weather pattern known as the 'Pineapple Express', a conditions which can inundate the Western US and Hawaii with rain. The MJO reaches it's peak during the transition from winter-to-summer and summer-to-winter. The southern quadrant of a strong northern hemisphere MJO pulse that pushes into the the North Pacific produces easterly wind, which in-turn pushes warm surface water of the West Pacific eastward. If it is strong enough it can potentially producing something known as a Kelvin Wave. Kelvin waves are not waves in the classical sense, but more like a pool of warmer-than-normal water that travels east under the oceans surface at a depth averaging about 150 meters. A Kelvin wave can be evidenced at the surface by a slight rise in sea surface height (8 cm) and slight temperature increase that covers hundreds of square miles of ocean surface. Once a Kelvin wave hits the South American coast (normally near Ecuador), the warm water it carries erupts upward, creating a large warm water pool at the surface. That warm water also starts to migrate south along the coast of Peru and north up towards Central American and Mexico, often reaching well into Northern California. A Kelvin wave is tracked primarily using an array of 70 buoys anchored along the entire width of equatorial Pacific, from Papua New Guinea to just off the Ecuador coast. Temperature sensors located a various depths along the buoys anchor-line record subsurface water temperature. The sensors relayed their data real-time via satellite to a central processing facility. At the processing facility the real-time temperature measurements are compared to historical and seasonally adjusted average water temperatures for each buoy location. A variety of reports are generated daily and posted on the Internet. Some reports highlight deviations from the 'normal' expected temperatures. Such deviations are called 'anomalies' and can register as either warmer than normal (El Nino) or cooler than normal (La Nina).
But there are other signals monitored that indicate a change in the El Nino/Southern Oscillation (ENSO) cycle. Wind speed and direction along the equator can be monitored by the buoy array and by the QuikSCAT satellite. Deviations in the normal pattern are easily highlighted. A persistent slackening or even change toward easterly winds in the West Pacific is a telltale sign of a developing El Nino. Conversely, strong westerly winds in the East Pacific are signs of a developing La Nina.
The Southern Oscillation Index (SOI), compares relative barometric surface pressure between Darwin, Australia and Tahiti. When pressure is comparatively high over Tahiti, and low over Darwin, the index is considered positive. This is typically the case. That is, clear blue skies prevail over the eastern Pacific off South America above the cold upwelling waters normally present there. When the reverse is true, the index is considered negative, and lower than normal pressure and a wetter than normal pattern sets up in the East Pacific, while a dry high pressure and drought ridden pattern sets up over the tropical West Pacific and Australia. A positive SOI indicates La Nina while a negative SOI indicates El Nino. NOAA reports that the SOI is not necessarily a good early-lead indicator. Rather, it turns negative only after a warm SST pattern has been in-place long enough over the East Pacific and with enough intensity to start modifying the atmospheric pattern above it.
Outgoing Longwave Radiation (OLR) anomaly data measures cloud reflectivity and cloud cover along the equator. If there is significant eastward shift in the amount of cloud reflectivity, it can be signaling the start of cloud migration from west to east. Warmer water supports better evaporation, which in turn produces clouds. As warm water starts migrating east, the clouds follow. An eastward shift in the OLR infers a corresponding shift in the rainfall pattern, which is often interpreted to be the first clear signs of El Nino starting to manifest itself in the atmosphere.
Early signs of a developing El Nino pattern can appear as early as late fall a year before a mature El Nino pattern sets in. But just because these signals appear, it does not always mean an El Nino will follow. The period from March to April during the year El Nino is forecast can make or break the forecast. It is not fully understood what physical processes take place during the seasonal transition, also known as the "Spring Barrier". But during this time, early signals of El Nino can disappear, to be replaced by a neutral to slightly La Nina like pattern. But if the signs persist through the Spring Barrier, the odds of a full scale El Nino developing go up significantly.
From a surf perspective during El Nino conditions, the north Pacific subtropical jetstream is enhanced, and a strong semi-permanent low develops just east of the dateline and south of the Aleutians. This situation enhances the potential for development of large winter storms and surf, but can also produce locally stormy conditions along the US west coast. During pronounced episodes, the jetstream can drive storm energy straight from Siberia clear across the Pacific and directly into the US, often taking a track right into the drier regions of Central and Southern California. This can bring significant rainand snowfall to dry regions of the southwest US in winter.
Conversely, La Nina has the opposite effect. Colder than normal water starts to develop in the eastern equatorial Pacific in the mid summer as the trades start raging from east to west (Peru to Asia). Strong high pressure builds over the eastern equatorial Pacific while low pressure follows the warm waters towards Asia. By Christmastime the North Pacific jetstream is displaced well north, driving up towards the Aleutians into Alaska and northern Canada, and high pressure dominates the NE Pacific pattern.
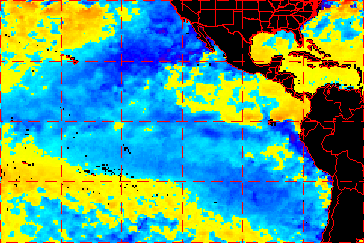
La Nina, the opposite of El Nino
Sea Surface Temperature (SST) anomalies on 6/9/98, 9/19/98, 1/19/98, & 5/8/99
(Blue depicts colder than normal SST's, orange-red warmer than normal. Notice the cooling of waters along the equatorial Pacific from June '98 thru May '99 as surface winds reverse direction and return to trades, blowing east to west. In the first image, warm water from El Nino is still present off Peru, but is slowly replaced by colder water. Notice the pulses in the cold water as surface winds begin to blow abnormally strong from east to west, pushing cold water towards Japan.)
Images Courtesy: NOAA NESDIS
For the Atlantic Ocean, El Nino and La Nina have equally dramatic effects, but in the opposite way as experienced over the Atlantic. During El Nino, the strong jetstream winds and storms blowing into the western US also blow across the equatorial Atlantic, shearing the tops of developing hurricanes, reducing water temperatures off the eastern US and the amount of energy and moisture available to feed tropical storms that emerge off the African coast. Conversely, during La Nina, a consistent flow off Africa at all levels of the atmosphere creates conditions ripe for tropical storm development.
(Also see NCEP Tutorial)
NEXT |