The best way to create an accurate surf forecast is to use actual observations obtained from multiple sources. Compare and contrast this data to verify the accuracy of other observations. One source of data is not enough. For example, just because a wave model currently indicates high seas, compare that to ERS-2 sea heights and QuikSCAT and SSM/I winds. Look at the surface pressure and wind analysis. If there is strong similarity between all your sources, then the probability for a particular outcome increases. The weaker the correlation, the less likely for that outcome to materialize. In searching through all the myriad of web sites dedicated to weather and surf forecasting, try to remember there are two high level categories of data: Current Data and Forecast Data. For surf forecasting, current data is by far the most important. It depicts weather events as they are actually happening and greatly increase the accuracy of your forecasts. Conversely, forecast data helps determine the probability for swell producing storms in the future. Near-term forecasts (those for the next 2-3 days) have a better probability of coming true, while longer-tern forecasts (4-10 days into the future) often are inaccurate or, at best, provide only a rough approximation of things to come. The proof is in the pudding, if it isn’t real, it doesn’t exist.
Use satellite photos to confirm the presence of potential swell producing storms. Then use the Surface Pressure analysis to mark it's location and confirm that it is in-fact present at the oceans surface. Determine if a gradient is present. Use the Surface Wind Analysis to confirm wind speeds are sufficient to produce a swell and to estimate fetch area and direction. About 12 hours later, use QuikSCAT, SSM/I or ERS2 wind data to confirm wind speed, direction and fetch area. Then use ERS-2 sea heights to confirm actual sea heights and 00hr wave models to confirm main swell vector heading, and sea height areal coverage.
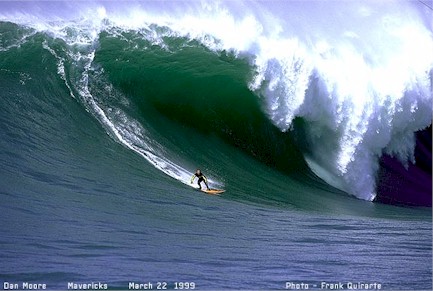
Monster Mavericks
A 948 mb storm with a solid gradient in the southern quadrant and lot's of 'virtual fetch' come together to make massive waves for a few brave souls on March 22, 1999.
Image: © 1999 Frank Quirarte at Mavsurfer
Everything you need to know about surf forecasting can be summed up in one sentence: Deep large long-lasting storms make strong winds, which make large seas, which make large swells, which makes big surf. All the technology on the web is there to help you identify and analyze whether these conditions exist. Don’t get lost in the technology.
If you're comfortable with what you've read so far, then maybe it's time to venture into deeper waters. Do you want to create your own surf forecasts? Do you want to know how it's all done? Then click HERE.
Happy hunting! |