|
|||
|
|||
|
|
|||
|
|||
|
Florida East Coast Surf Report
(includes Cocoa Beach, Sebastian Inlet, New
Symrna Beach and Jacksonville Beach)
This surf report contains buoy data and images that depict the current state of the ocean and atmosphere for the Florida Atlantic swell window. Use this page to track storms, observe arriving swells, and determine winds and tides at your beach.
Also see Buoy Data, Current Weather
& Tropical Update
About Powertools & Links
**Links open a new window. When finished viewing, close the window and select another**
Surf Cams
Arranged from North to South
| Camera Location | Refresh Rate/Provider |
| Fernandina Beach | Once Daily FBsurfreport.com |
| Jacksonville Beach | Near Real-time JaxSurfCam.com |
| Jacksonville Beach |
Updated at first
light & again if it's good |
| Jacksonville Pier | Updated several times daily with report too. Surfjaxpier.com |
| Jacsonville - Mayport Poles | Picture and report updated daily Thepolesreport.com |
| St Augustine | Pic updated 3 times daily surf-station.com |
| Daytona Beach Shores | Every 5 minutes Volusia County |
| Cape Canaveral | Updates realtime Twopalms.com |
| Canaveral Pier | Updates realtime Gosurfsportwear.com |
| Cocoa Beach (16th Street) | Daily (also has written report) SurfingCocoaBeach.com |
| South Cocoa Beach | Daily 2ndLight.com |
| Satellite Beach | Daily (also has written report) Satbeachsurf.com |
| Indian Harbour Beach | Daily pic barrierislandgraphics.com |
| Indiatlantic Beach Boardwalk | Daily pics Surfguyssurf.com |
| Indiatlantic | Daily pics Wavecaster.com |
| Melbourne Beach | Every
Minute Surfcam.net |
| South Melbourne Beach | Daily, or more Matt-Nick-Surfline.com |
| Jupiter Inlet | Jupiter Inlet District |
| Martin County Beach | Realtime Erdman Video Systems |
Stormsurf Buoys
(Click a buoy for detailed swell and surf data)
 |
Buoys
Arranged from North to South
Courtesy: NBDC & NOAA OMB
Current Observations Swell Forecast Buoy Number Buoy Name Primary Observation Secondary Observation Spectral Density of Current Observation 6 hr Hindcast & 180 hr Forecast
(NOAA OMB)SE US COAST
OffshoreTo view buoy locations select a Buoy Map: Buoy Map North
& South44004 Hotel Buoy NDBC Wave Met Spec Dens Forecast 41001 East Hatteras Buoy NDBC Wave Met Spec Dens Forecast 41002 South Hatteras Buoy NDBC Wave Met Spec Dens Forecast 41010 Canaveral East Buoy NDBC Wave Met Spec Dens Forecast Nearshore 41004 Edisto Buoy NDBC Wave Met Spec Dens Forecast 41008 Grays Reef National Marine Sanctuary Buoy NDBC Wave Met Spec Dens Forecast 41012 St Augustine NDBC Wave Met Spec Dens Forecast 41009 Canaveral Buoy NDBC Wave Met Spec Dens Forecast PUERTO RICO North (19.00N - 66.50W) South (17.50N - 66.50W)
- NDBC = National Data Buoy Center - Primary Source for Wave and Wind Observations
- Wave Met = Links to the NDBC FTP server which is often up when the prime web server is down.
Two links provided: One to detailed 'Wave' data, the other to 'Meteorlogical' data (including Significant Sea heights). Heights are in meters, Time in GMT/UTC. Field descriptions can be found here: Wave Met- Spec Dens = Links to the National Data Buoy Center. Dispalys the amount of energy in each spectral band by period.
- Buoy Forecast is from the Wavewatch III Wave Model courtesy of NOAA OMB.
Tabular display tracks up to 6 swells as they converge on any buoy simultaneously. Identifies Significant Wave Height, Swell Height, Period and Direction hourly for the previous 12 hours and 72 hours into the future. Wherever possible, the Regional Model is used to increase accuracy. Heights are in meters, Period in seconds. Direction indicates where the swell is heading. Add or substract 180 degrees to calcuate where it came from.
Spectral Density
(Canaveral Buoy 41009)
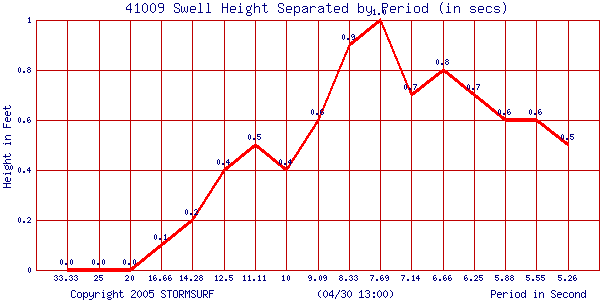 |
Swell Trend for Buoy 41009
Canaveral Buoy
Courtesy: National Data Buoy Center (NDBC)
Swell Height (in ft) & Period (in secs)
Patrick AFB Wind Report
North Atlantic GOES-8 Infrared
Satellite Image
Courtesy: UNISYS/University of Purdue
 |
Wind Conditions via RUC2 Model
(updated every 3 hours)
Courtesy: NOAA FSL
Southeast US Coast
 |
Current Global Winds Via QuikSCAT
Satellite Based Sensors
(Ascending Pass)
Courtesy: NOAA OPPT
 |
Local Marine Wind Conditions Via
QuikSCAT Satellite Based Sensors
(Ascending Pass)
Courtesy: NOAA OPPT
 |
Current 00hr NOAA Wave Model
Courtesy: Scripps Research Institute
(Uses NOAA Wavewatch III Wave Model)
| Height | Period |
 |
 |
Current 00hr NOAA Wavewatch III Wave
Model
Courtesy: NOAA OMB
| Height | Period |
 |
 |
Current Southeast US/Gulf of Mexico
Regional NOAA Wave Model
Courtesy: NOAA OMB
| Height | Period |
 |
 |
Stormsurf Buoy Forecasts
(Click a buoy for detailed swell and surf data)
 |
Tides
Courtesy: Biological Sciences, University of
South Carolina
1075
|
|||||||
|
|||||||
