|
|||
|
|||
|
|
|||
|
|||
|
El Nino Southern Oscillation
Quick-Look Images
(Current Observations and Forecasts)
--- Current Conditions ---
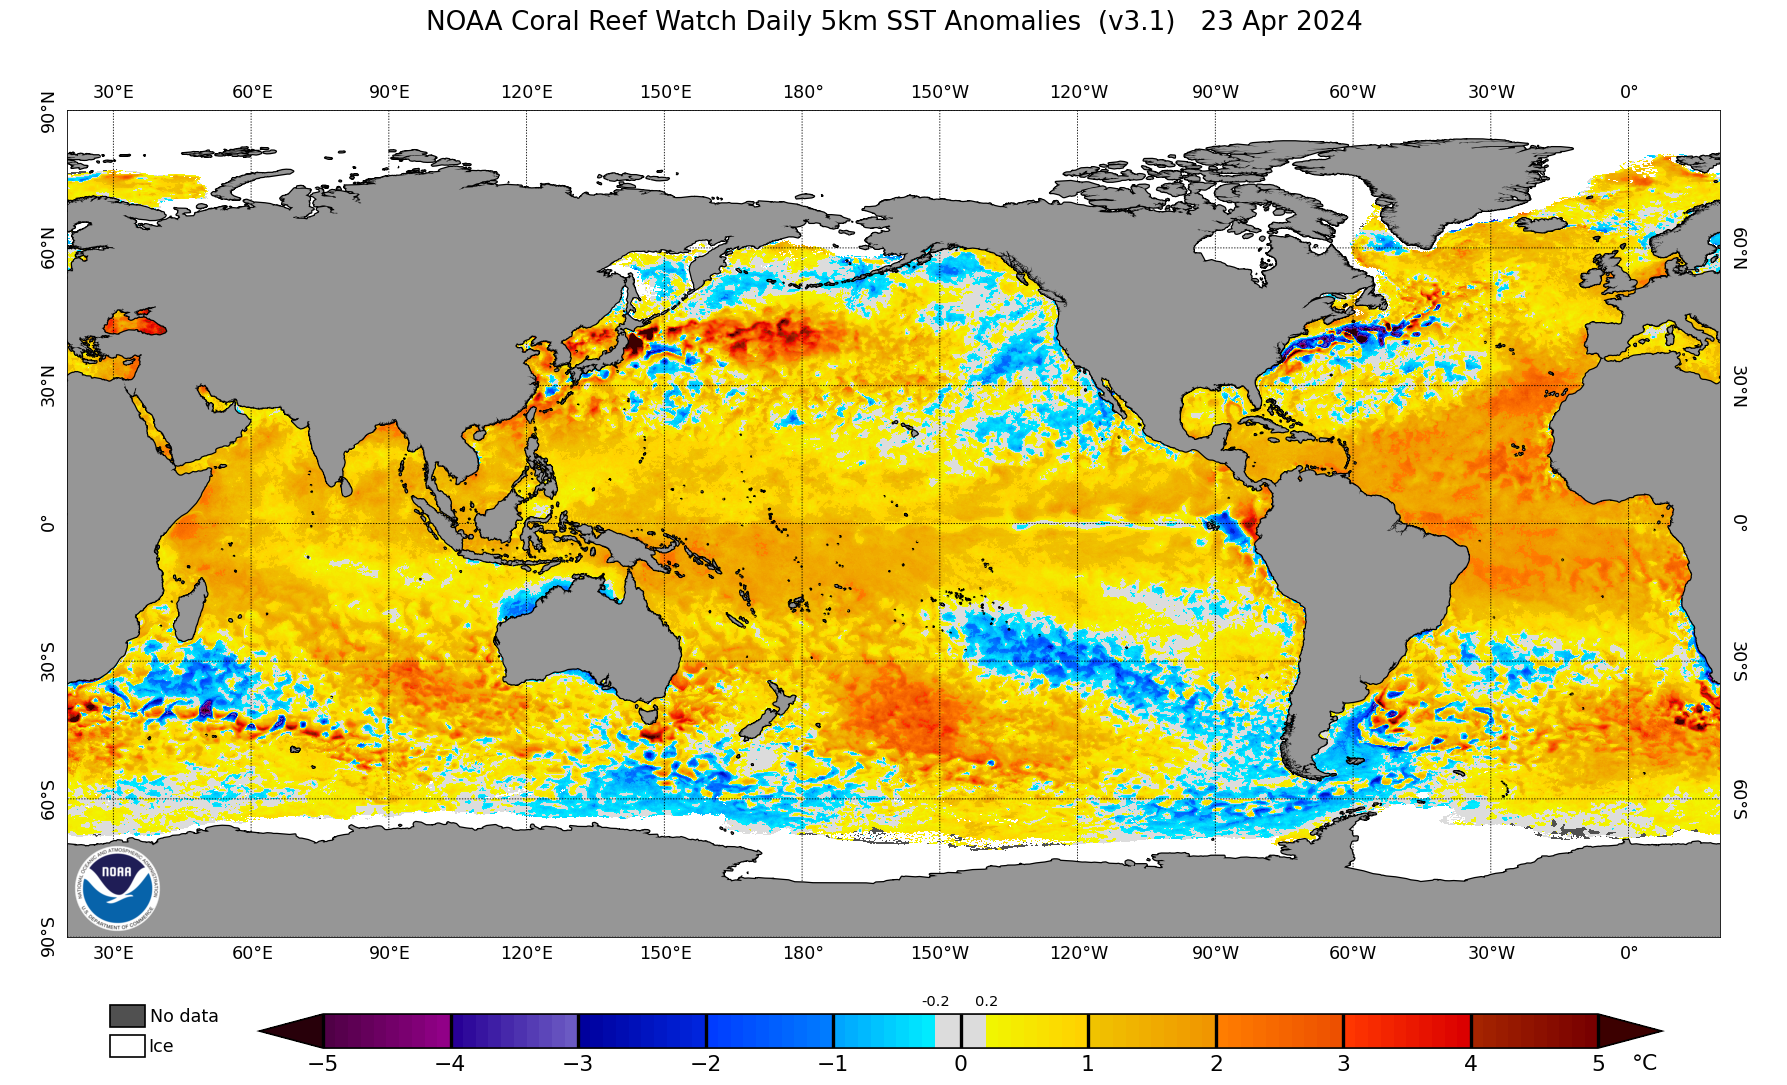
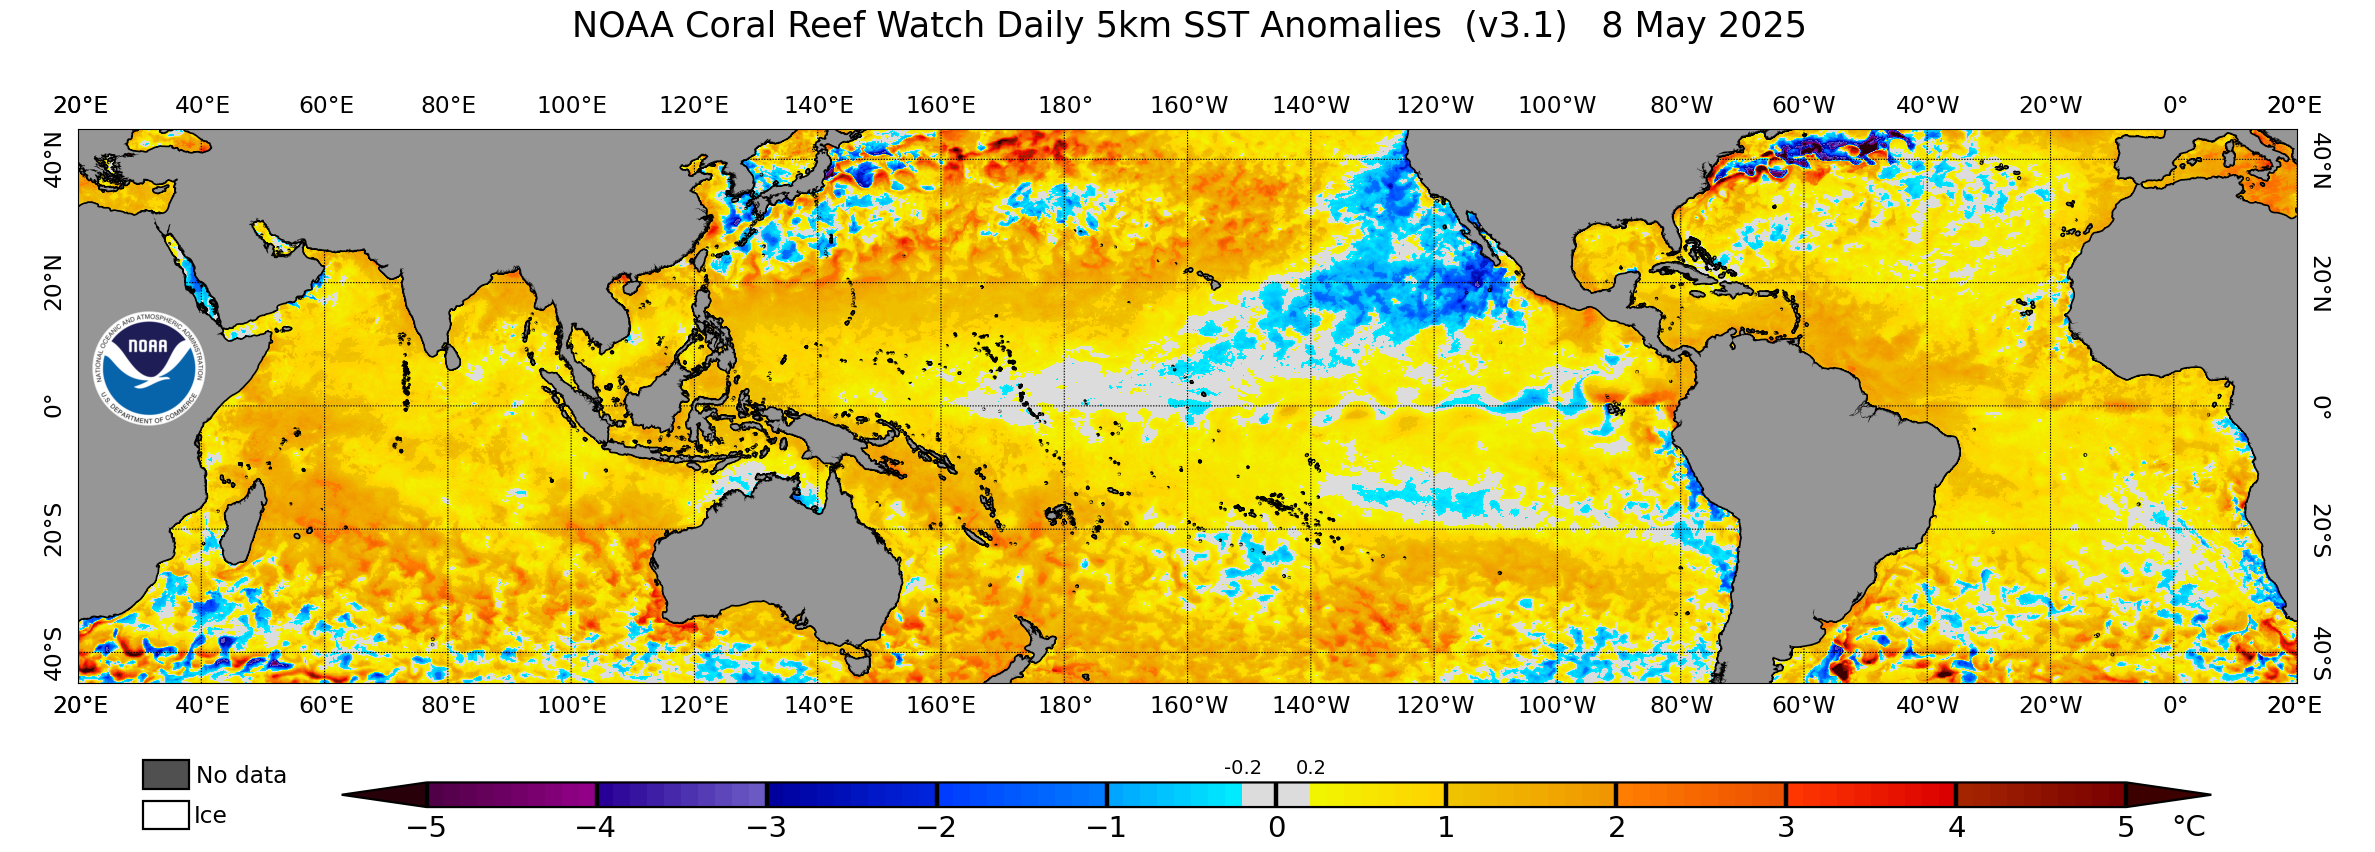
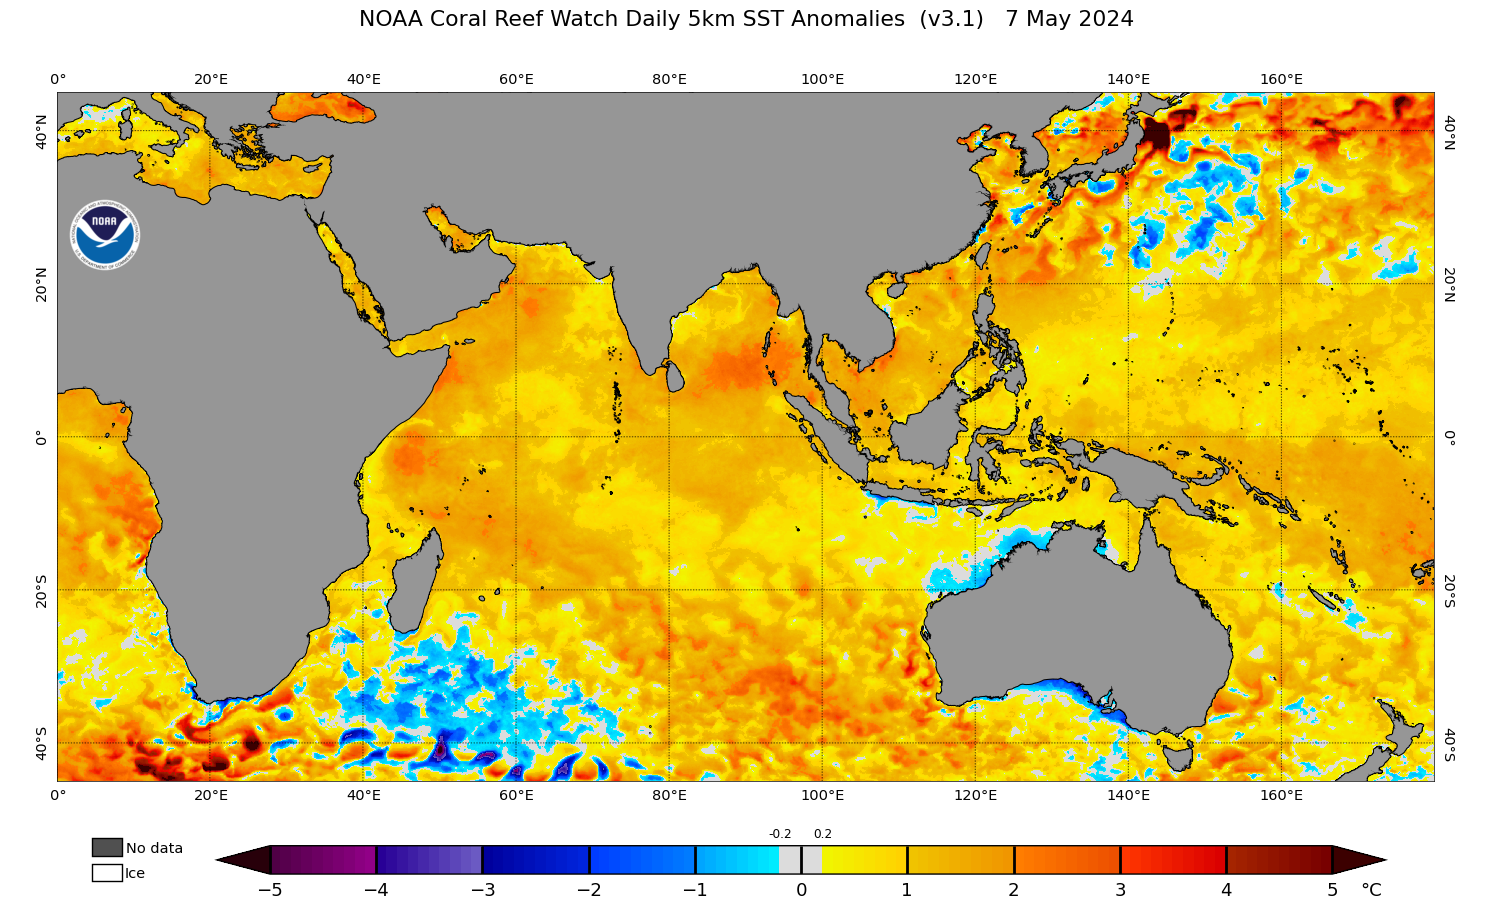
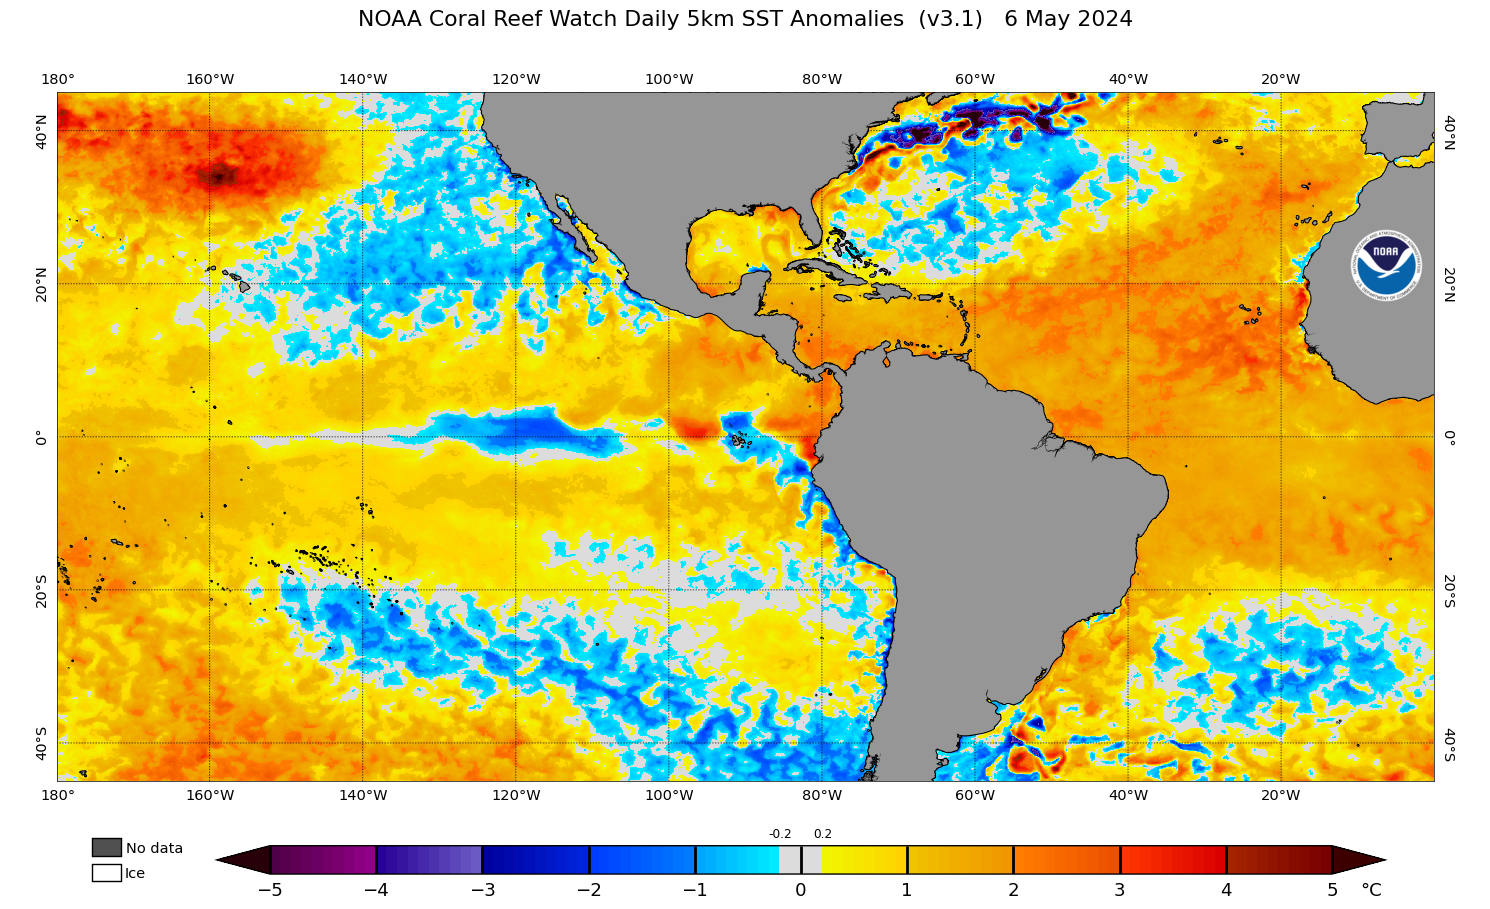
Global Sea Surface
Temperature Anomalies
Courtesy: NOAA OSPO & NOAA Satellite and Information Service
Yellows represent warmer than normal waters (seasonally adjusted)/Blues are cooler than normal
Hi-Res (5 km)
 |
Hi-Res (5 km)
 |
Historical Animation ( 2 images/year on Aug 1 & Dec 20 - From 1985 -> present)
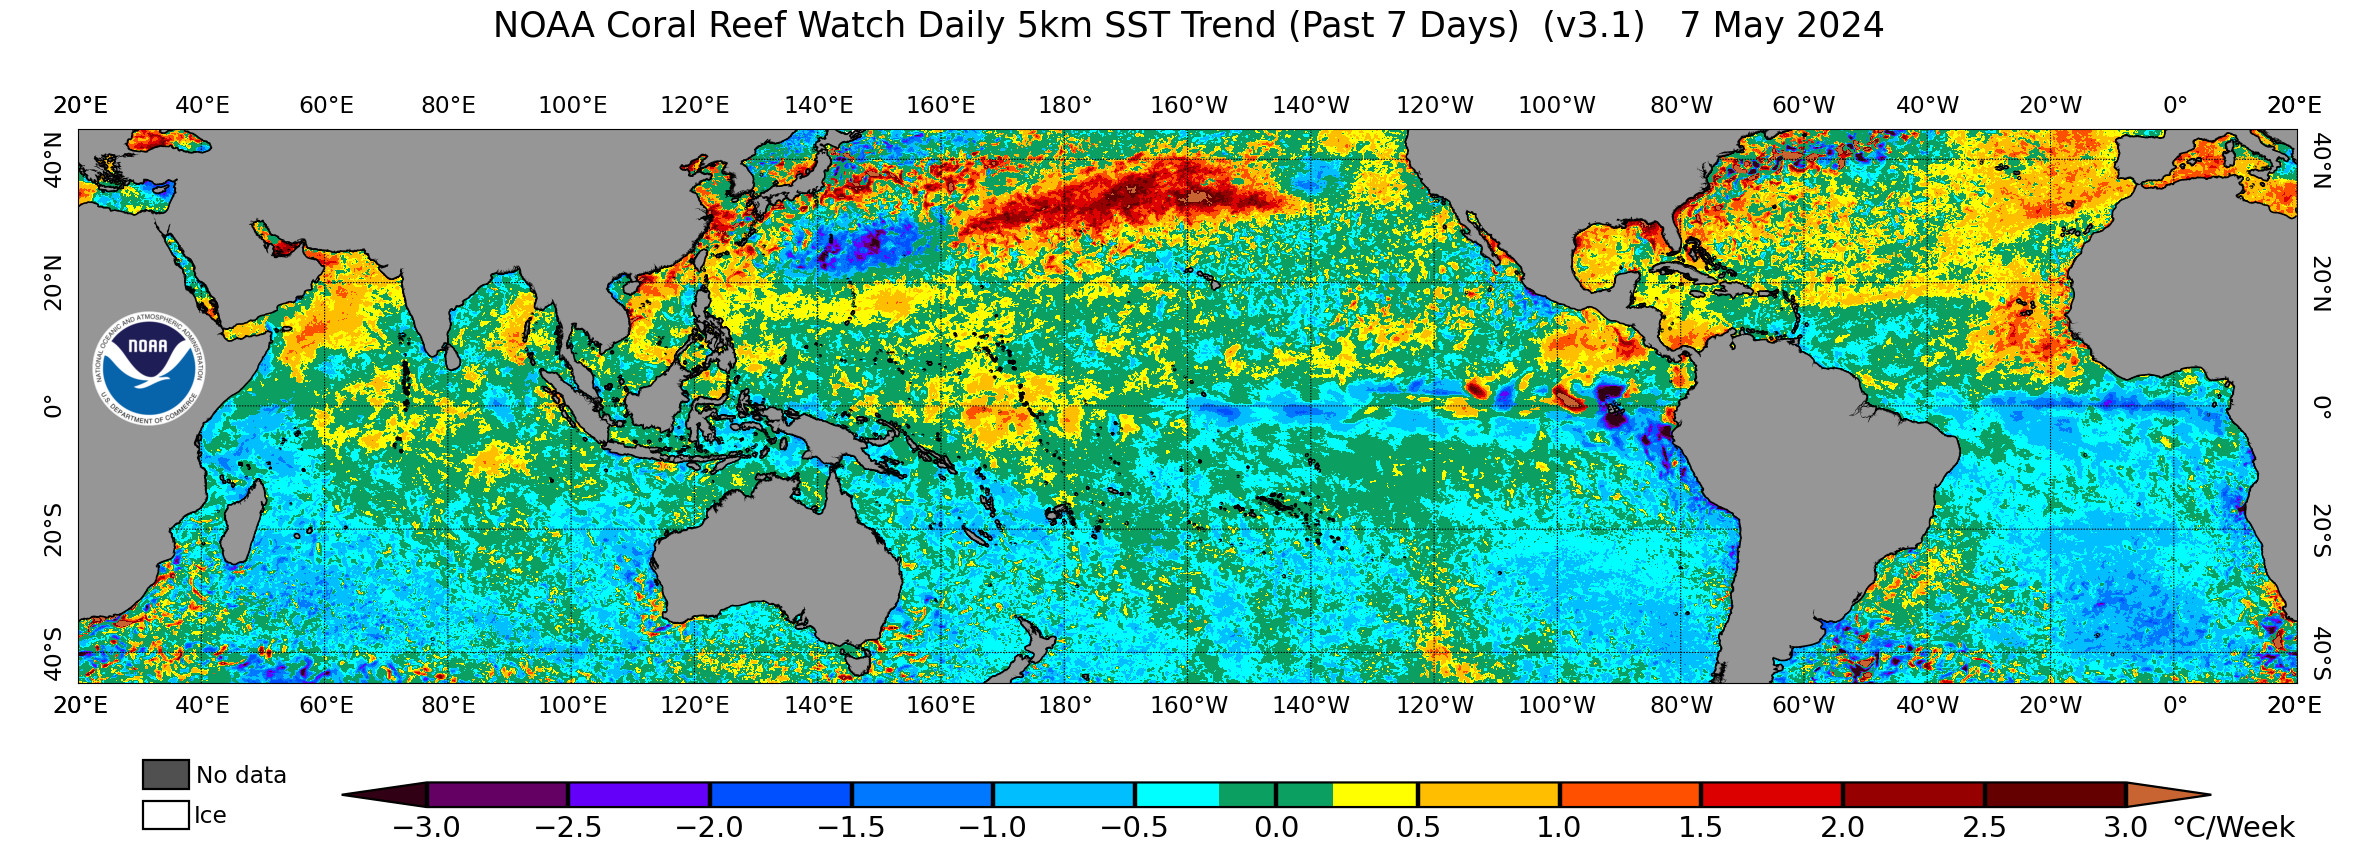
Hi-Res 7 Day Trend (5 km)
 |
Hi-Res Zoom (5 km)
 |
 |
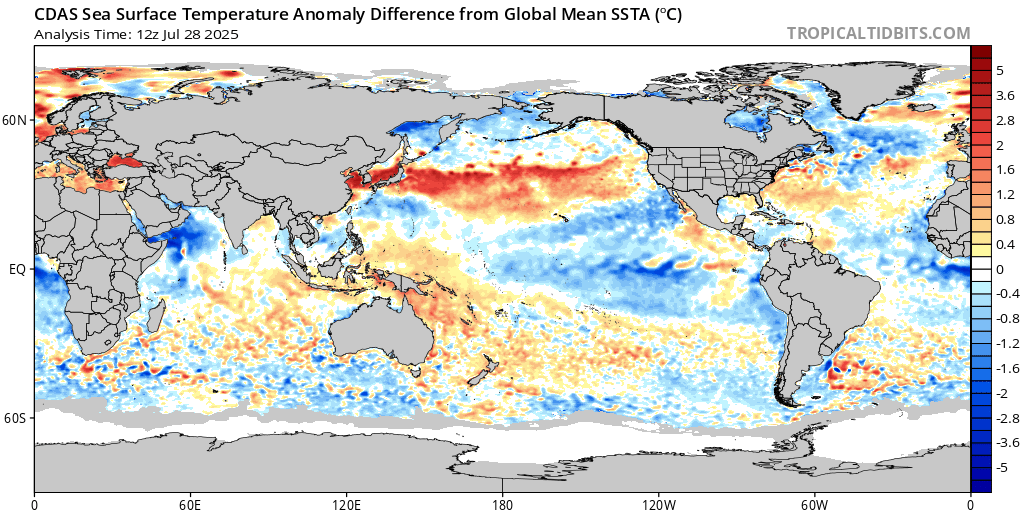
Alternative - SST Anomalies
(Difference from Gloabal Mean Temp)
Courtesy: Tropical Tidbits
Sea Surface temperature difference from the global average for this exact point in time. This is an attempt to show true Sea Surface Temperature Anomalies versus using NOAA's method by comparing todays temps to a 30 year running average updated every 5 years. For delineating ENSO events, there are concerns the NOAA technique is not as valid as it used to be in a rapidly warming ocean environment.
 |
15 Day SSTA Trend
 |
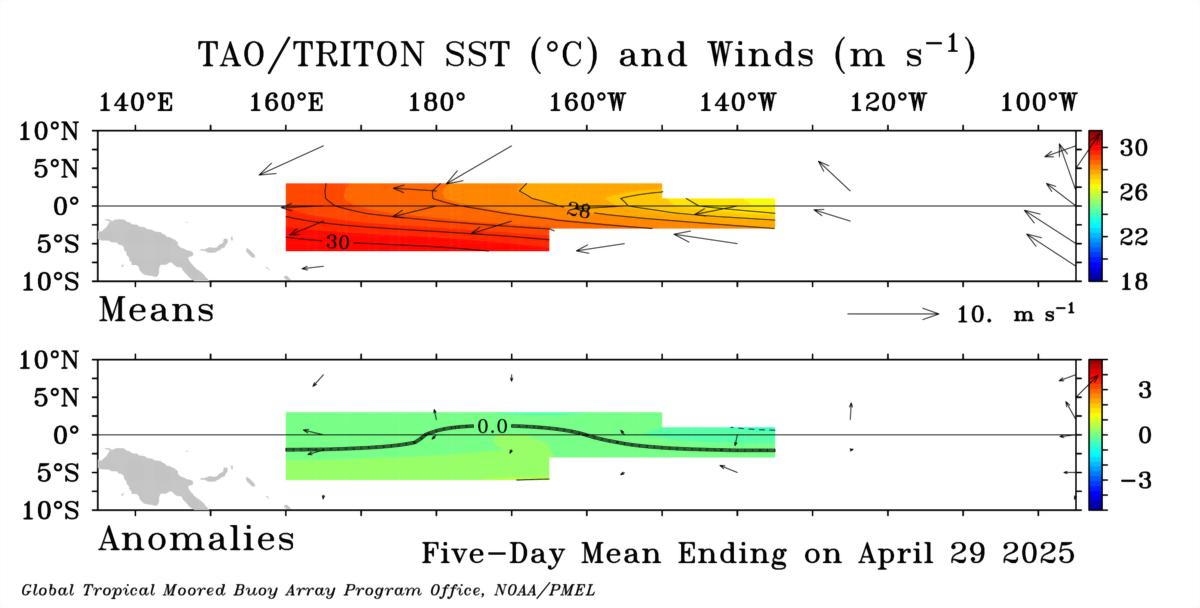
Equatorial Pacific
Ocean Sea Surface Wind and Water Temperature Anomaly
Courtesy: NOAA PMEL
Upper Panel: Actual Sea Surface Temps (SST) (C) and wind direction/speed.
Lower Panel: SST and wind anomalies - West-to-east winds and warmer than normal water temps are indicative of El Nino
 |
Time series of Weekly SST Anomalies - 4 Nino Regions
Courtesy: CPC NCEP NOAA
Sea Surface Temperature (SST) anomalies for the 4 Nino regions over time - updated weekly.
 |
Raw Nino 1.2 & Nino 3.4 SST Anomaly History
Courtesy: Tropical Tidbits
Top Panel: Nino 1.2 Sea Surface Temperature Anomaly History for last 3 months
Bottom Panel: Nino 3.4 Sea Surface Temperature Anomaly History for last 3 months
 |
 |
Relative Nino 3.4 SST Anomaly History
Courtesy: CyclonicWX
Top Panel: Relative Nino 3.4 Sea Surface Temperature Anomaly History for last 3 months
Bottom Panel: Relative Nino 3.4 Sea Surface Temperature Anomaly History for the last year in comparison to other significant El Nino years
 |
 |
Equatorial Sea Surface Temperature Anomaly History
 |
Equatorial Pacific Ocean Sea Surface Height Anomaly
Courtesy: NOAA CPC
Subsurface warm water is evidenced by increases in surface water height as compared to normal. Cold water at depth is evidenced by decreases in the surface water height. This data can be used to validate the presence of Kelvin Waves in the equatorial Pacific. Data obtained from the Jason-2 satellite.
 |
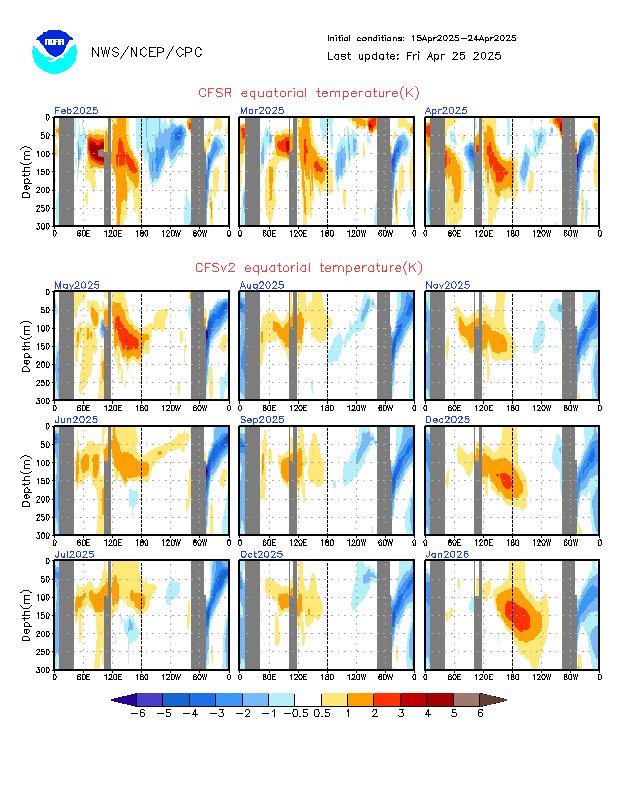
Equatorial Pacific Ocean Sub-Surface Water Temperature and Anomaly
Courtesy: NOAA PMEL
Kelvin waves are evidenced by pockets of warmer than normal water at the 200m depth. Over time they travel slowly west to east, rising to the surface in the far East Pacific as they impact the South American coast.
 |
GODAS Sub-Suface Water Temp Animation (5 day Increments)
Courtesy: NOAA CPC
 |
Equatorial Upper Ocean (300 m) Heat Anomalies
Courtesy: NOAA CPC
Kelvin Waves are evidenced by pockets of warmer than normal water tracking from west to east
 |
Equatorial Upper Ocean (300 m) Heat Anomalies - Time Series
Courtesy: NOAA CPC
Upper Ocean temperatures from 180W-100W in time series format.
 |
Southern Oscillation Index - 30 day Average
Courtesy: BOM
Measures the relative surface pressure difference between Darwin Australia and Tahiti. Consistently negative values indicate El Nino, positive values La Nina. Short negative spikes are associated with the active phase of the MJO. Continual active MJO events contribute greatly to the SOI and each individual event can generate westerly wind bursts that result in Kelvin Waves.
Link to image
MJO: Amplitude
Courtesy: NOAA
This chart depicts a historical look at the strength of the Active Phase of the MJO. There is no indication of where that Active Phase is located, though it is assumed to be either in the Indian Ocean or the West Pacific (as that is where it typically is the strongest). This data tracks well with the 30 day SOI average chart above.
|
Outgoing Longwave Radiation (OLR)
(Total & Anomaly)
Courtesy: CPC/NCEP/NOAA
Negative values represent increased clouds (more sun radiation absorption)/Positive values indicate less clouds (more reflection) and the inactive phase. Broad areas of negative values over the equatorial Pacific tracking from the Indian Ocean in to the Western Pacific are normally associated with the active phase of the MJO. Also broad negative values can establish themselves over warm water associated with a developing El Nino.
 |
Global Outgoing Longwave Radiation (OLR) Anomalies 5N-5S
 |
Madden-Julian Oscillation: Global 850 mb Wind Anomaly
Courtesy: NOAA
Winds blowing strongly west-to-east represent a reversal of trade winds and potentially an Active Phase of the MJO/Winds blowing strongly east-to-west indicate above normal trades and the Inactive Phase
|
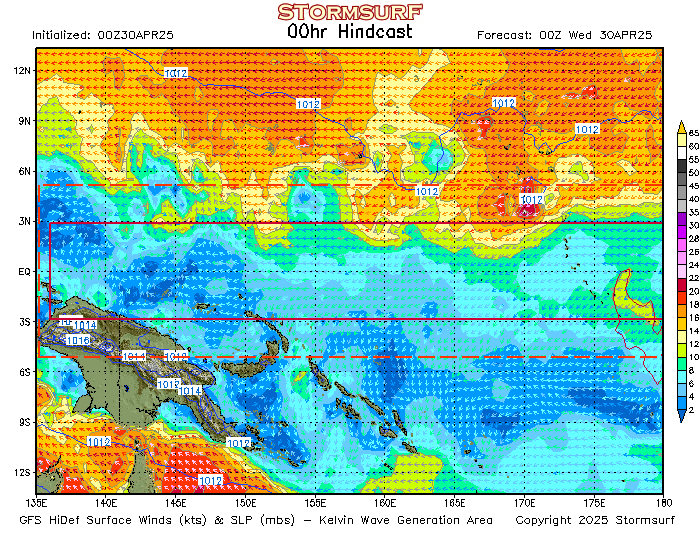
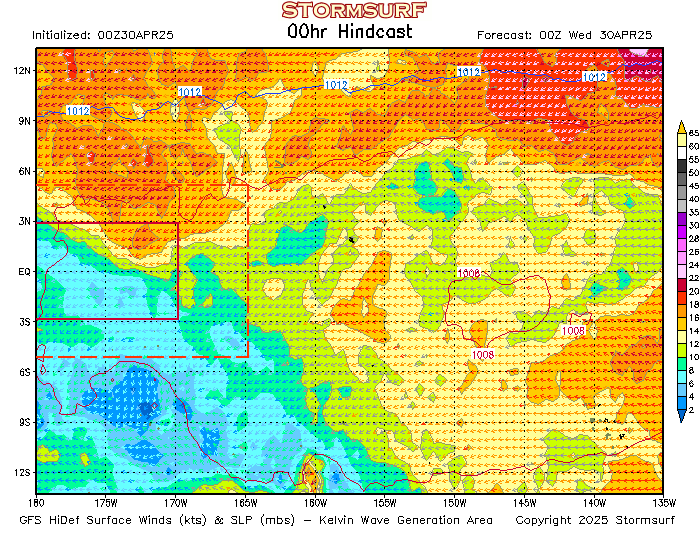
Kelvin Wave Generation Area: 10 Meter Winds - Current Analysis
Winds blowing from west-to-east in the boxed area represent a reversal of trade winds, an Active Phase of the MJO or El Nino, and if they persist will generate a Kelvin Wave. Strong trades (east to west winds) are indicative of the Inactive Phase of the MJO or La Nina. Data from GFS model.
|
|
--- Forecast Conditions ---
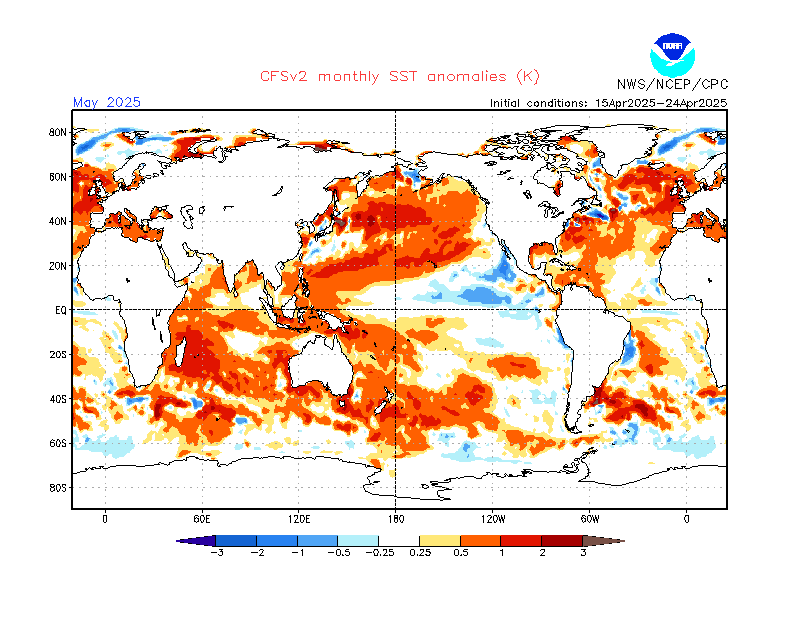
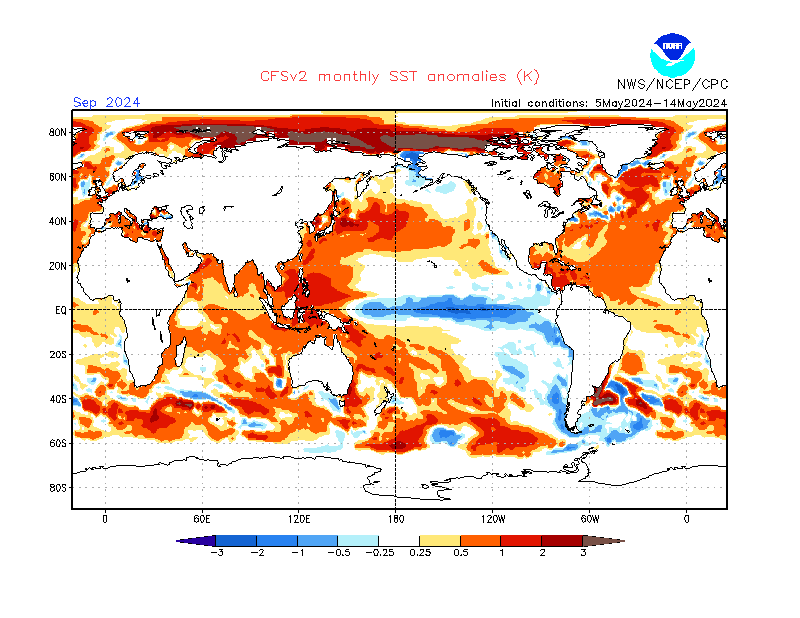
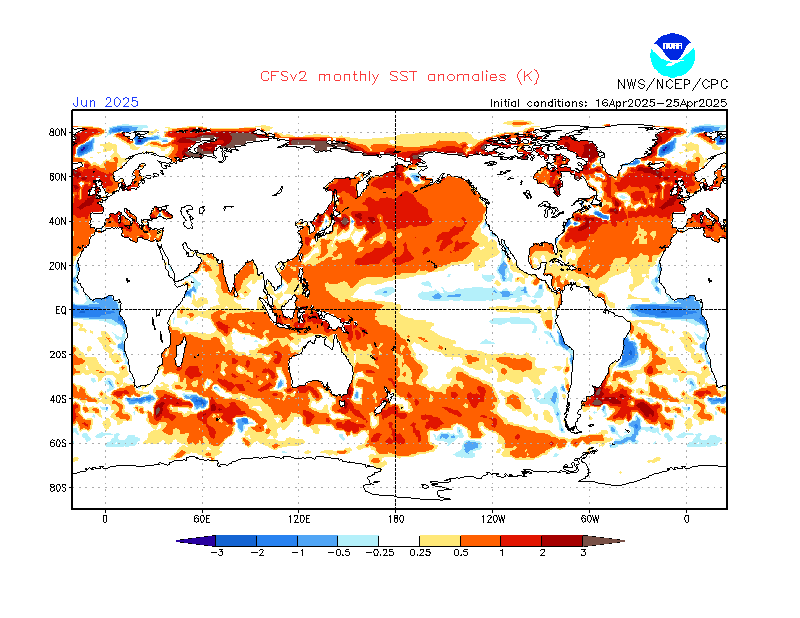
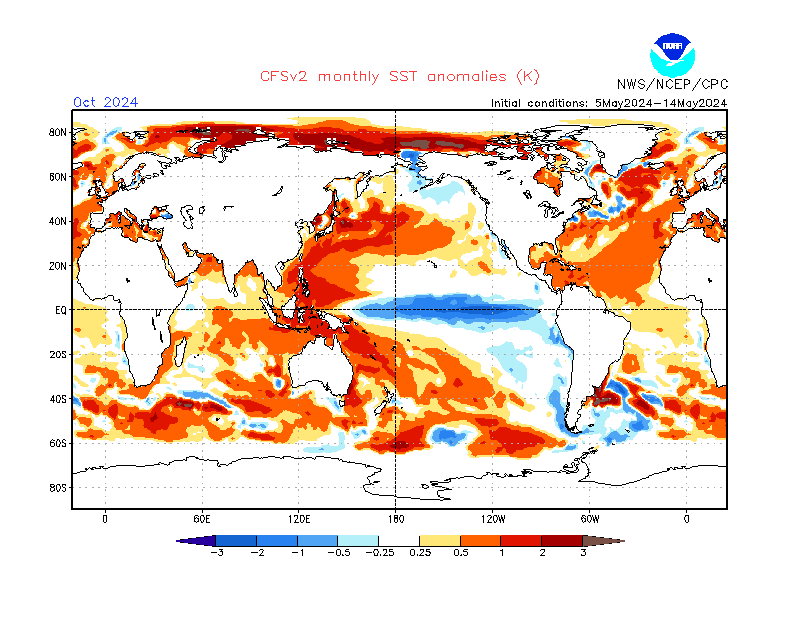
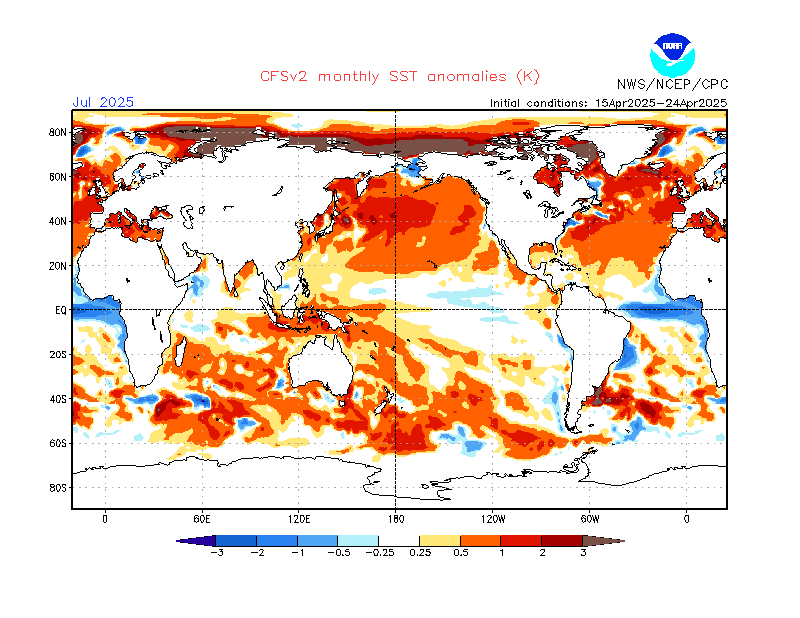
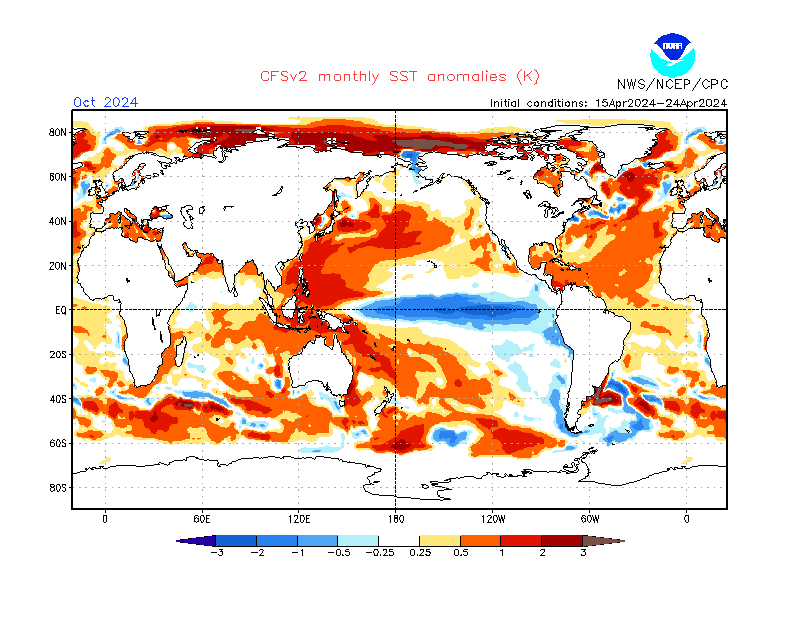
Sea Surface
Temperature Anomaly Forecast
CFSv2 - Nino 3.4 - Monthly - Most Recent Ensemble (E3) (L to R, Top to Bottom):
Raw, PDF + Spread Correction, Relative, PDF + Spread Correction Relative
Courtesy: NCEP NOAA CPC & Here
 |
 |
 |
|
|
|
|
|
|
|
 |
 |
 |
 |
 |
 |
With Skill Mask - PDF Corrected
CFSv2 - Equatorial Sub-Surface Temperature Anomaly Forecast
|
Madden-Julian Oscillation: Current and Forecast
30 Day Historical 850 mb Zonal Wind Anomaly & 14 day Forecast - 5S-5N
Courtesy: Michael Ventrice
This chart contains both prior zonal wind anomolies and forecast anomalies (at the bottom).
Positive values represent anomalous winds blowing west-to-east and the active phase of the MJO
Negative values indicate above normal trades and/or the Inactive Phase
|
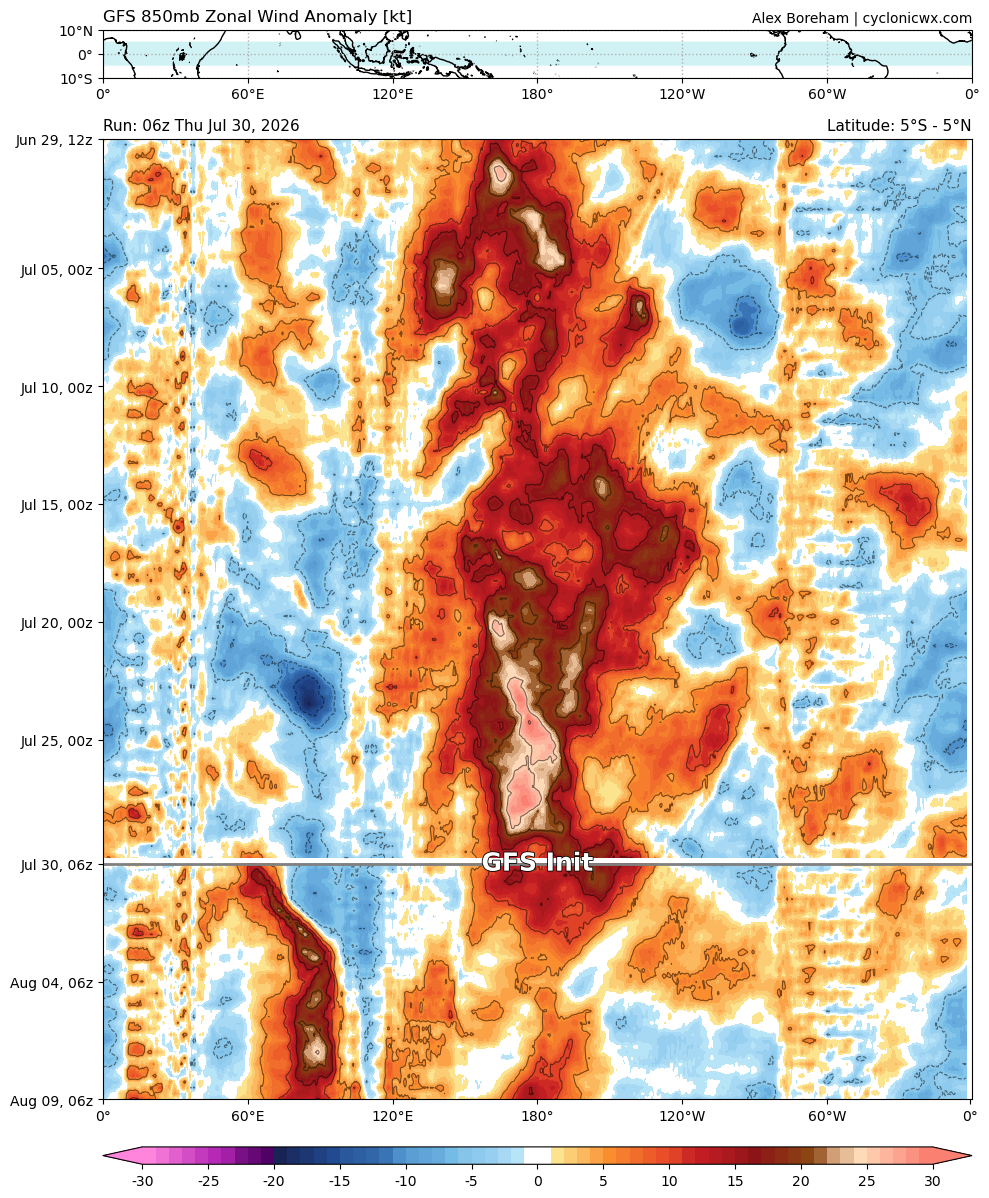
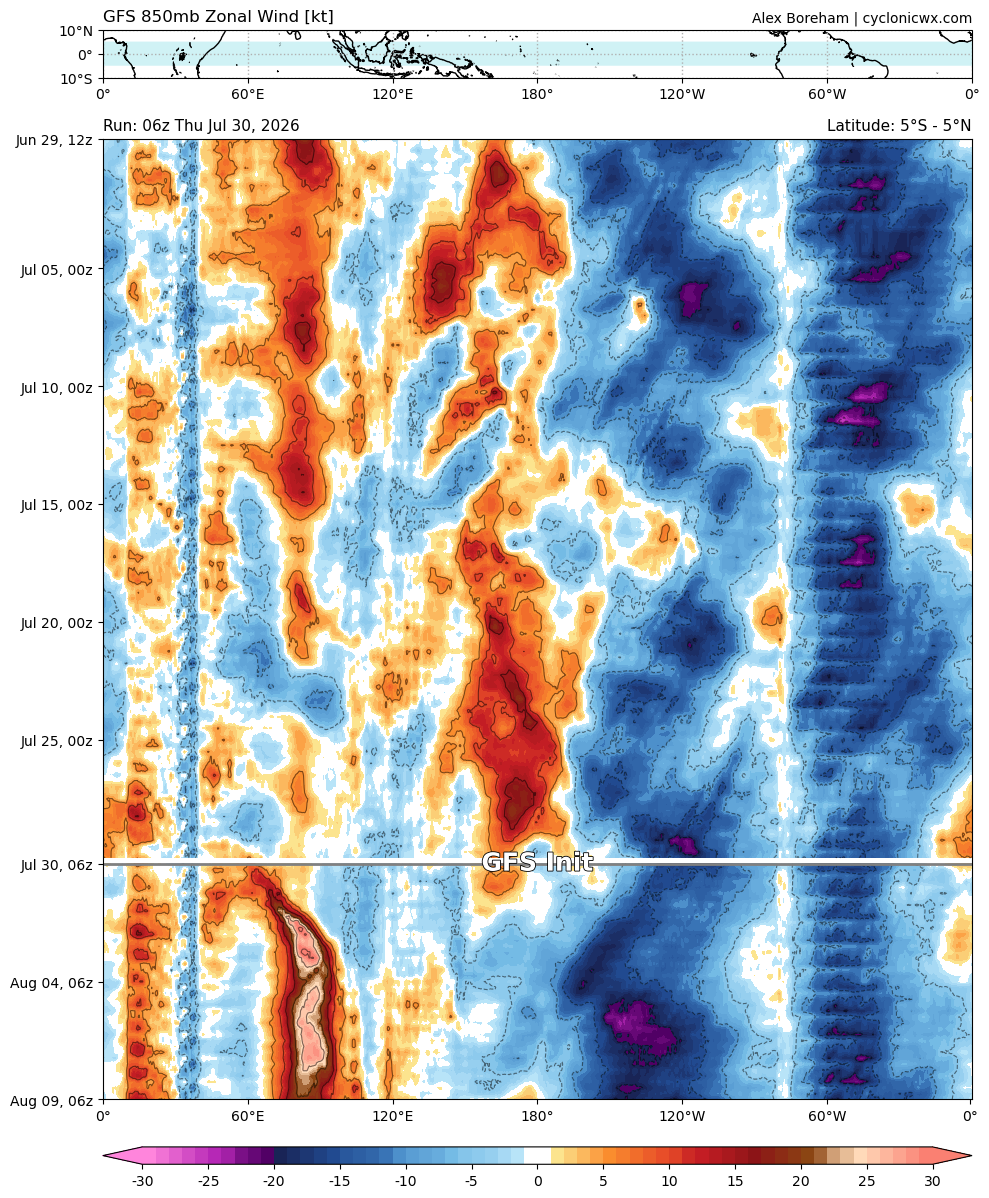
30 Day Historical 850 mb Zonal Wind Anomaly & 14 day Forecast - 5S-5N
Top Row: GFS wind speed and direction anomalies (left) and actual wind direction and speed (right).
Bottom Row: ECMWF wind speed and direction anomalies (left) and actual wind direction and speed (right).
CyclonicWX
|
 |
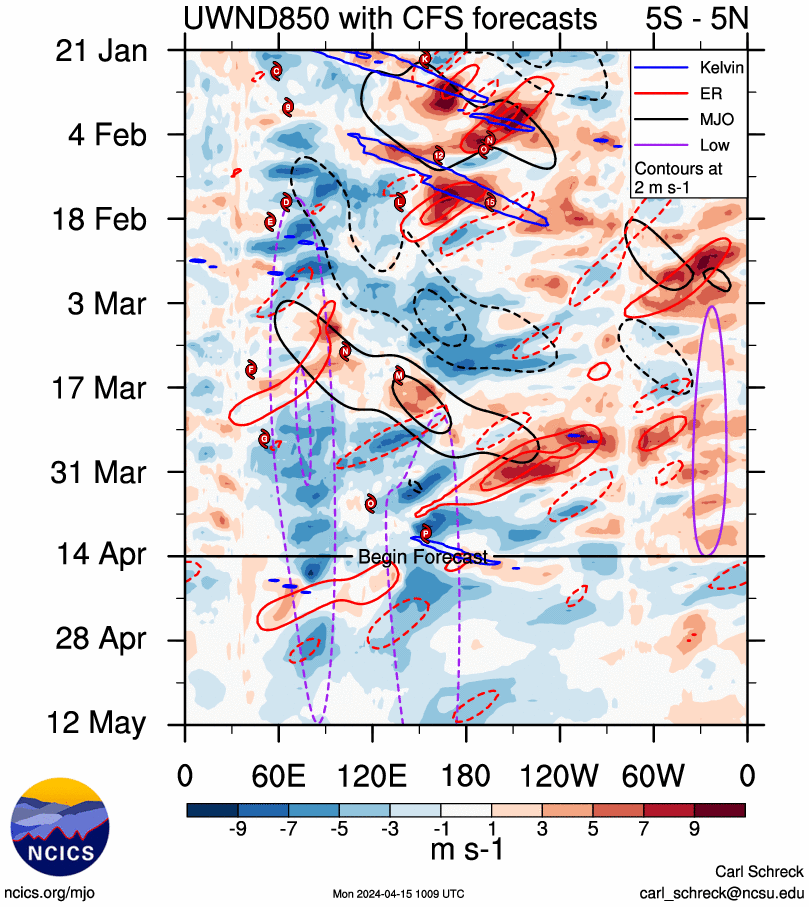
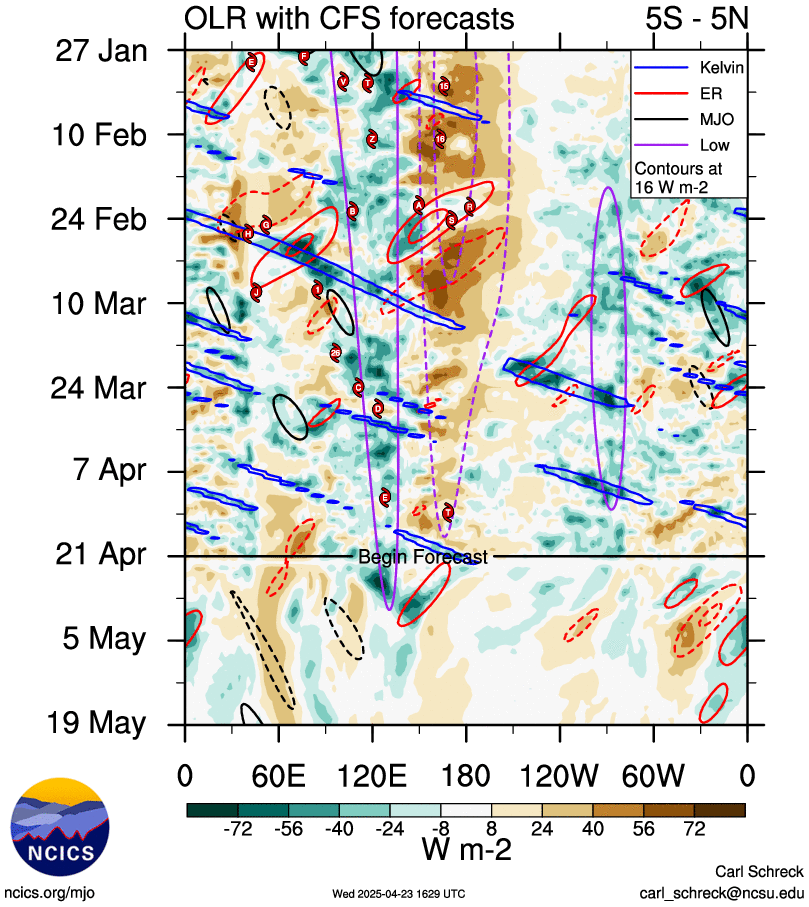
30 Day Historical 850 mb Zonal Wind Anomaly or OLR & 4 week Forecast Plus Equatorial Waves - 5S-5N
Courtesy: Carl Schreck
Same as above but includes atmospheric Rossby and Kelvin Waves plus Active/Inactive MJO and a low pass filter to identify El Nino
|
 |
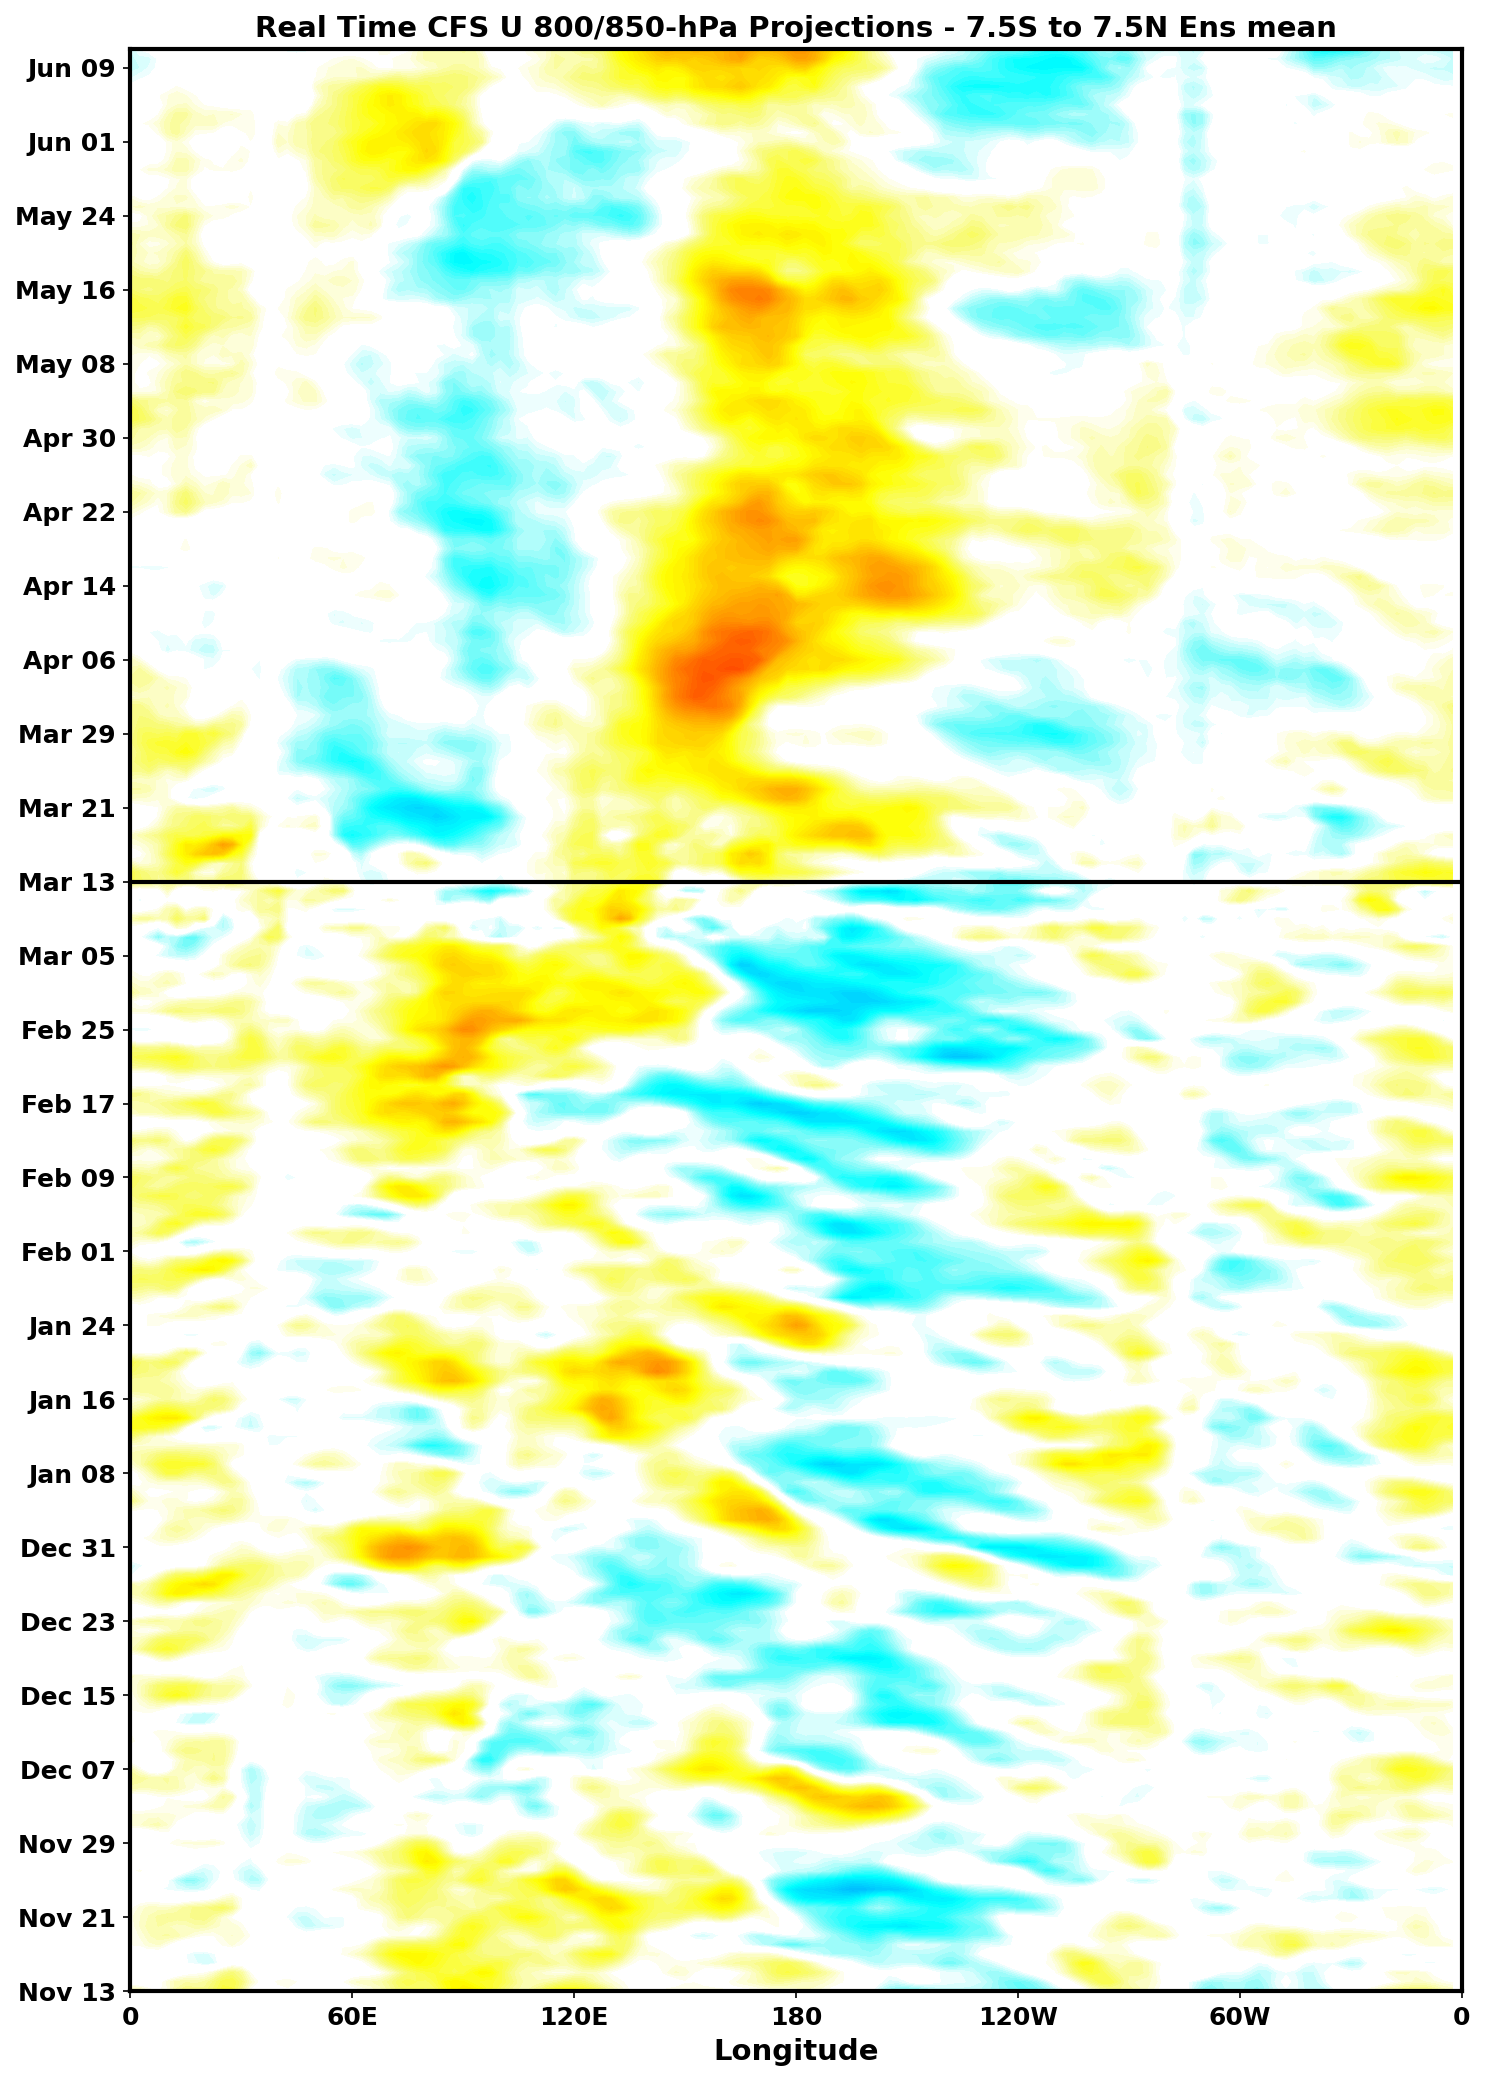
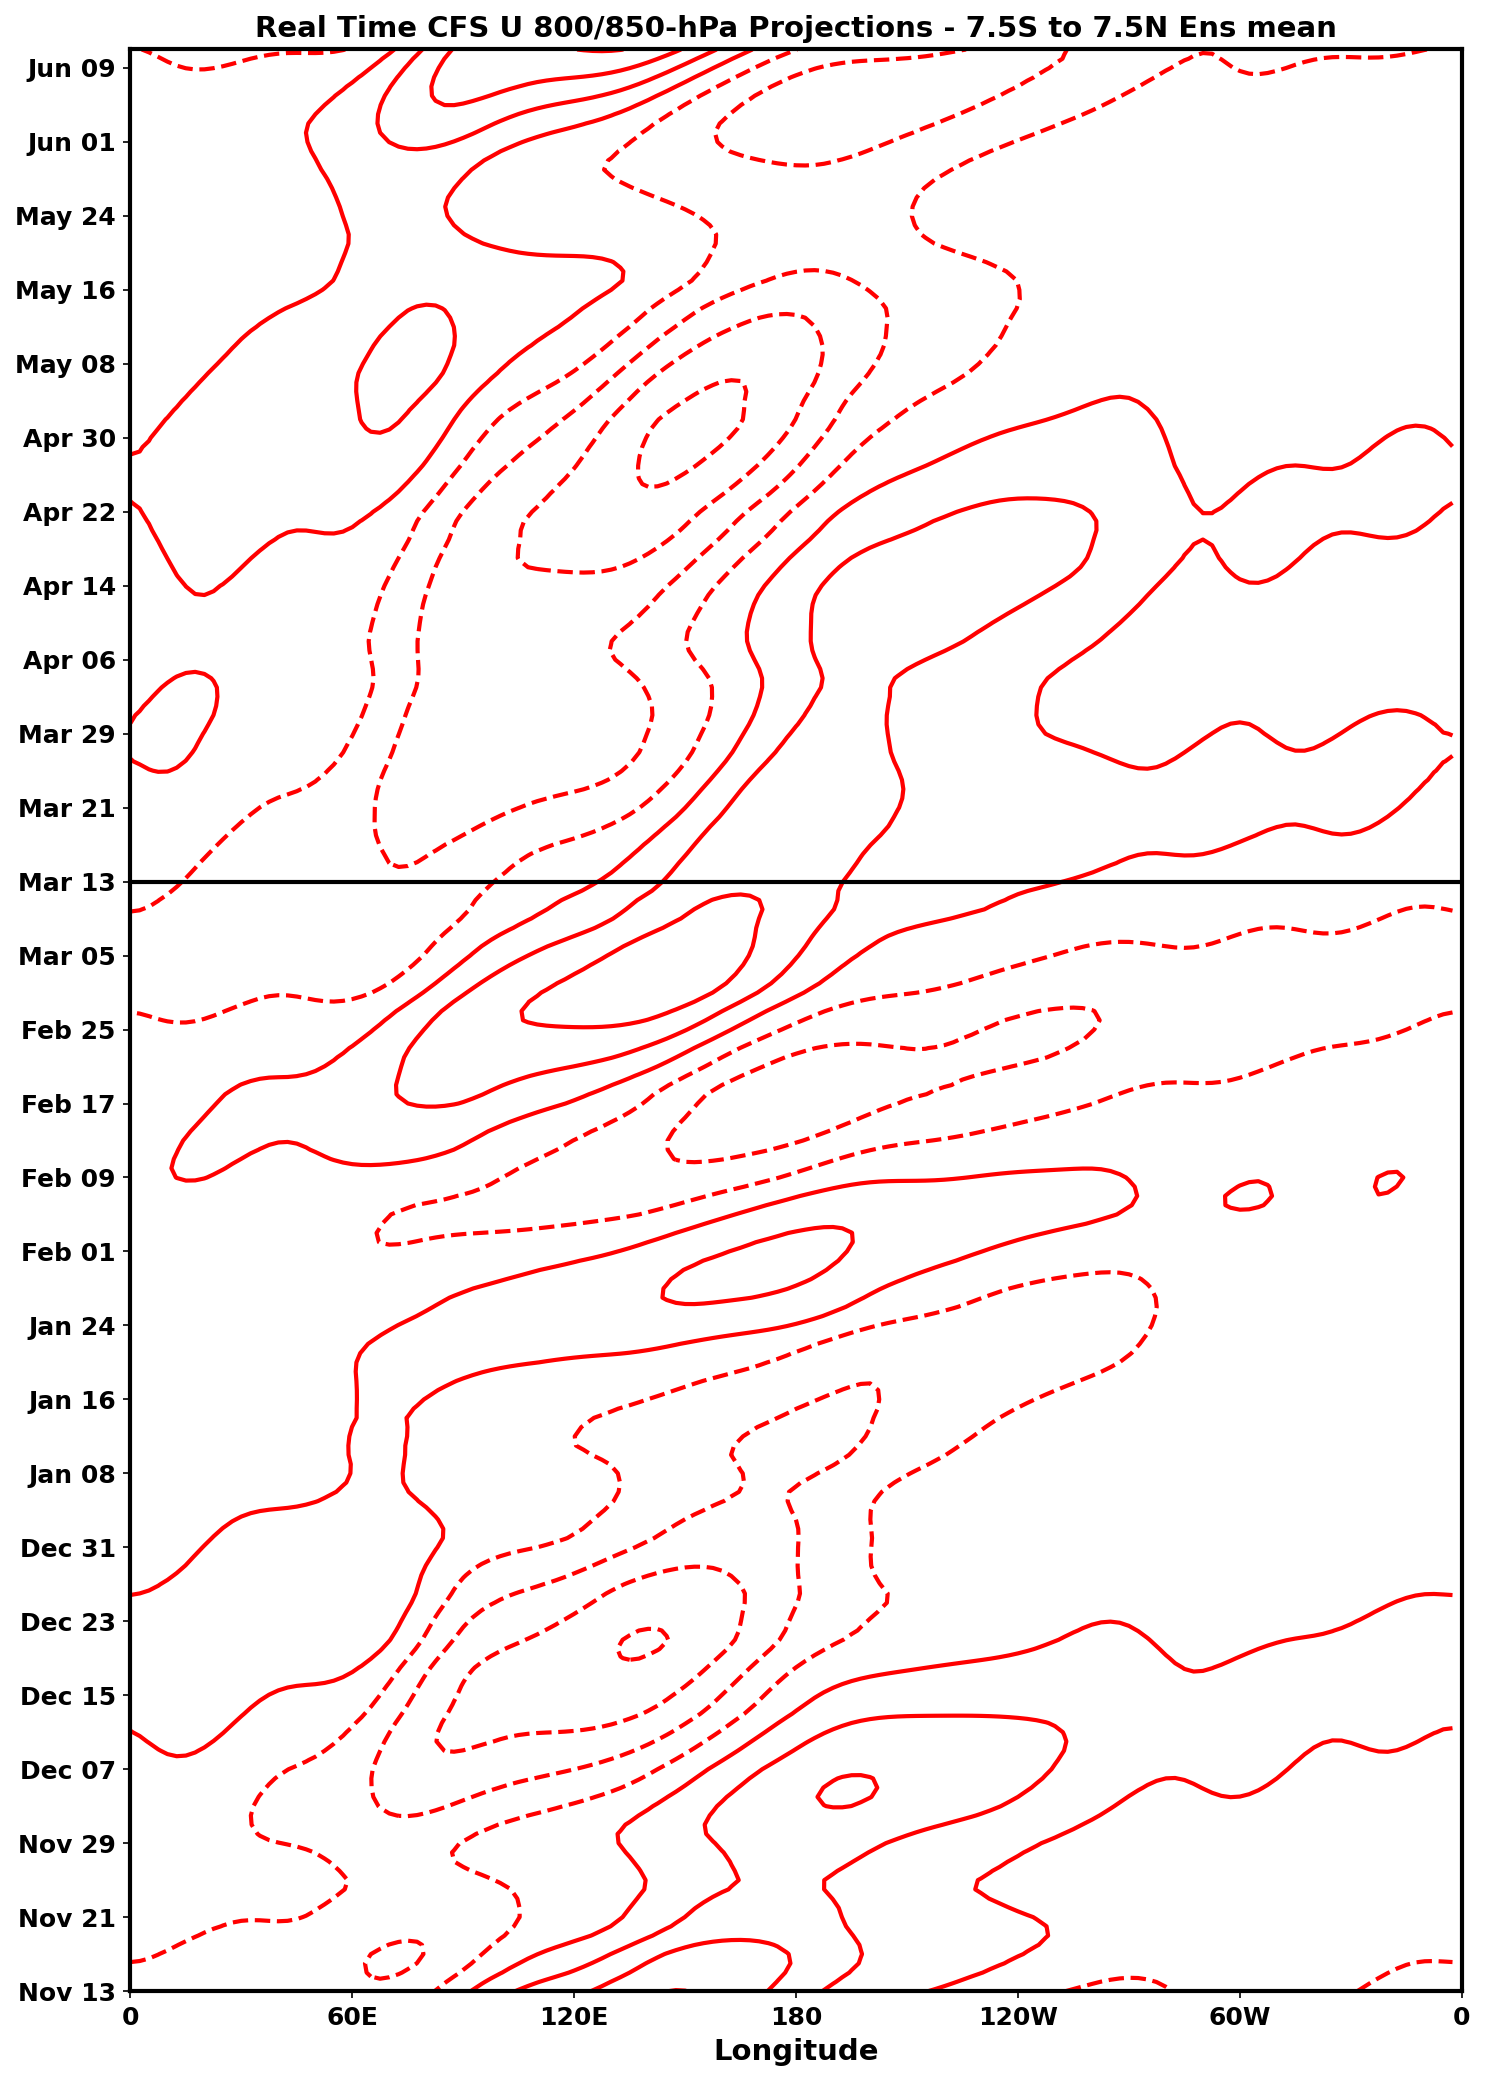
Madden-Julian Oscillation - 3 Month 850 mb Zonal Wind Forecast for Equator (7.5N to 7.5S)
Courtesy: Kyle MacRitchie
Forecast is in the top half of image, Hindcast is lower half.
Color Shades = Wind Anomalies (Yellow = Westerly Anomalies/Active MJO & Blue = Easterly Anomalies/Inactive MJO)
Red Countours indicate MJO Phase (Solid = Active Phase & Dotted = Inactive Phase)
Black Countours indicate High or Low Pressue Bias (Solid = Low Pressure/possible El Nino & Dotted = High Pressure/possible La Nina)
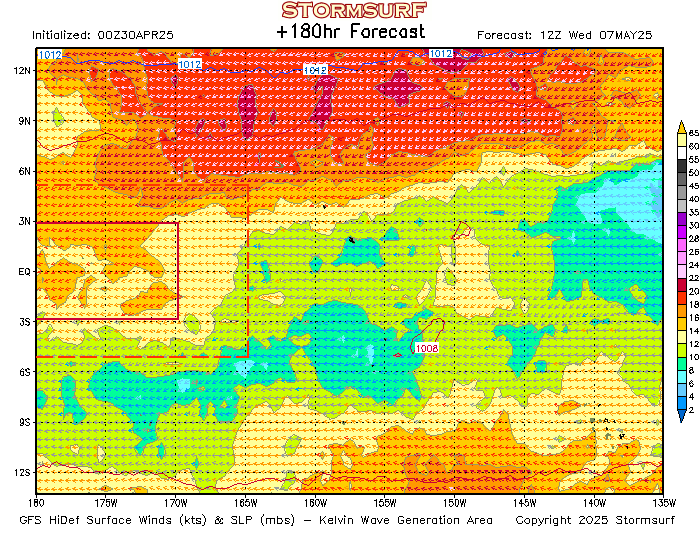
Kelvin Wave Generation Area: 10 Meter Wind Forecast - 180 hrs
Winds blowing from west-to-east in the boxed area represent a reversal of trade winds, an Active Phase of the MJO or El Nino, and if they persist will generate a Kelvin Wave. Strong trades (east to west winds) are indicative of the Inactive Phase of the MJO or La Nina.
|
|
Madden-Julian Oscillation: Phase Diagram
40 day Hindcasat and 15 Day Statistical & Dynamic (GFS Ensemble) Forecast Position and Strength of the Active Phase of the MJO
Courtesy: NOAA CPC
This chart contains both prior and forecast positions of the the core of the Active Phase of the MJO. Location is plotted with respect to 8 Phases or positions around the globe. Phase 1 is over west equatorial Africa. Phase 5 is in the far West Pacific. East anomalies lead the core, peak precip is in the core, west anomalies trail the core. Strength is measured by distance from the center, the further away from the center the stronger.
 |
 |
Phase Diagrams from more models and longer durations
Madden-Julian Oscillation: OLR 15 day Forecast
Courtesy: NOAA
Statistic Model top, Dynamic Model bottom. Negative values represent increased clouds (more sun radiation absorption) and the Active Phase of the MJO/Positive values indicate less clouds (more reflection) and the Inactive Phase. Broad areas of negative values over the equatorial Pacific tracking from the Indian Ocean in to the Western Pacific are normally associated with the Active Phase of the MJO. Also broad negative values can establish themselves over warm water associated with a developing El Nino.
|
 |
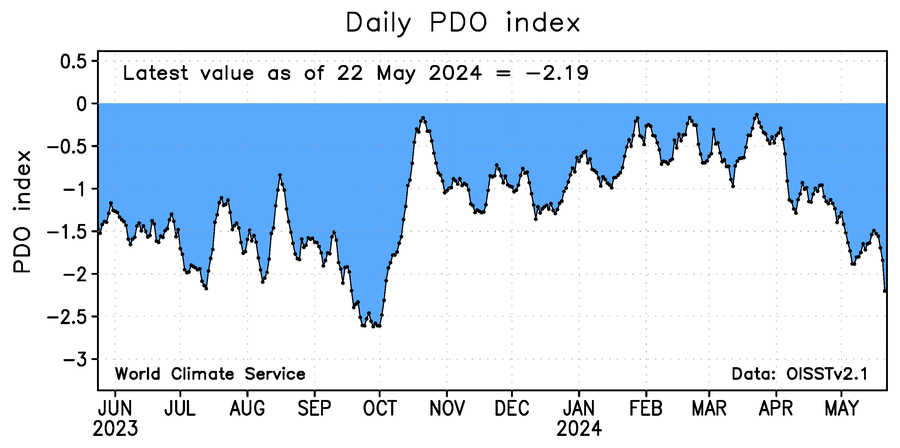
Pacific Decadal Oscillation - Daily
Courtesy: World Climate Services
Negative values represent the 'Cold' Phase (condition similar to a long running La Nina) - Positive the 'Warm' Phase (a long running El Nino).
|
Assorted Data Links
Multivariable ENSO Index
2 Month Data
'Relative' Sea Surface Temperature Anomalies
Weekly - Monthly (ERSSTv5) - Monthly (OISSTv2.1) - Seasonal (ERSSTv5) RONI
'ONI' Centered Sea Surface Temperature Anomalies
(1991-2020 base period)
Weekly (OISSTv2.1) - Monthly (OISSTv2.1) - Monthly (ERSSTv5) - Seasonal Centered ONI (ERSSTv5)
Pacific Decadal Oscillation (PDO) Links
NOAA Standard PDO - SST PDO - Upper 300 meter PDO
25523
|
||||||||
|
||||||||