|
|||
|
|||
|
|
|||
|
|||
|
NORTH ATLANTIC IMAGERY
Northwest
Atlantic Infrared Satellite Image
(From GOES-EAST Satellite)
Courtesy: Purdue/UNISYS
 |
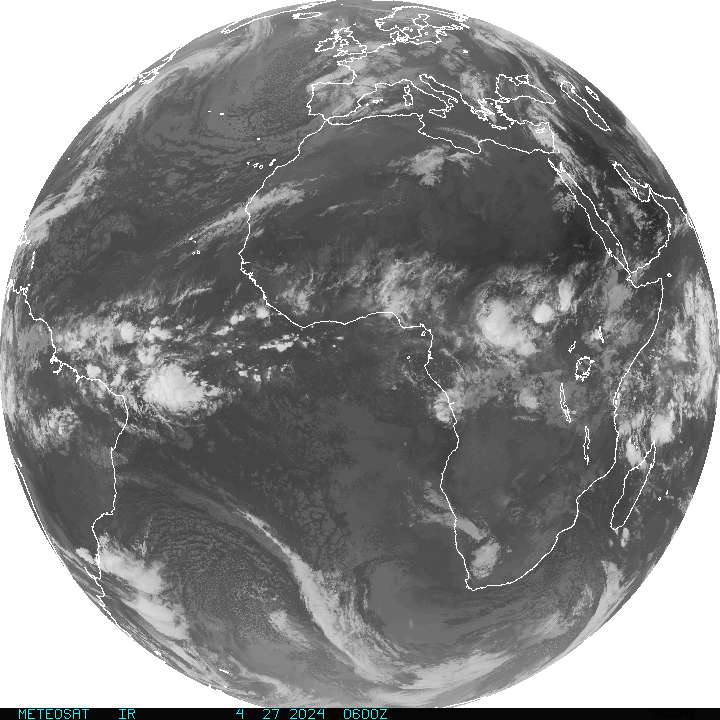
Northeast
Atlantic Infrared Satellite Image
(From METEOSAT Satellite)
Courtesy: NOAA
 |
GOES-8 Infrared Satellite
Image with NOGAPS Surface Pressure Overlay
Courtesy: NRL Monterey
 |
METEOSAT
Infrared Image with NOGAPS Surface Pressure Overlay
Courtesy: NRL Monterey
 |
Northern
Hemisphere MRF Surface Pressure and 500 mb Model
Courtesy: Purdue/UNISYS
 |
ETA Model
Surface Level Pressure (SLP) and Winds
Courtesy: NCEP
 |
QuikSCAT
Surface Winds
Courtesy: NOAA OPPT
Ascending
 |
Descending
 |
Atlantic
Ocean Wavewatch III Wave Model - Heights and Period
Courtesy: NOAA OMB
| Height | Period |
 |
 |
North Atlantic
Ocean Wavewatch III Wave Model - Heights and Period
Courtesy: NOAA OMB
| Height | Period |
 |
 |
Western North
Atlantic Wavewatch III Model - Sea Heights and Period
Courtesy: NOAA OMB
| Height | Period |
 |
 |
Western North
Atlantic US Wavewatch III Model - Sea Heights and Period
Courtesy: NOAA OMB
| Height | Period |
 |
 |
North Atlantic Wave Model
- Sea Heights and Swell Period
[Uses Wavewatch III Model
spectral peak period and direction]
Courtesy: Scripps Research Institute
| Height | Period |
 |
 |
Europe/NE Atlantic Wave
Model - Sea Heights and Swell Period
[Uses Wavewatch III Model
spectral peak period and direction]
Courtesy: Scripps Research Institute
| Height | Period |
 |
 |
9837
|
||||||||
|
||||||||
