Historically Strong El Nino In Control
More Warming Underway
Overview:
A strong El Nino is developing. It began its lifecycle in late 2013 when a primer WWB and Kelvin Wave developed. Then in early 2014 a historically strong push by the Active Phase of the MJO resulted in a large Kelvin Wave, and anomalies continued in the Spring into early Summer transporting more warm water eastward. But the cycle faltered in July due to a protracted bout of the Inactive Phase of the MJO which enabled the upwelling phase of the Kelvin Wave cycle to manifest driving cooler water east, muting warm water buildup along the Ecuador coast. Still the warm water pipe remained open, but surface temperatures near the Galapagos never recovered and any atmospheric momentum was lost. Then in early 2015, another historically strong push from the MJO occurred, effectively a repeat of the early 2014 event, invigorating the warm water transport process and, adding more heat to an already anomalously warm surface pool off Ecuador. That pool has been building steadily in spurts ever since. The paragraphs below describe the current status of various El Nino indicators, followed by a few paragraphs that tie all the pieces together and provide our analysis of what is to come.
Each
section first provides a basic tutorial on the feature being analyzed (in italics),
and it's state during El Nino and La Nina years. It is followed by an
analysis of how that feature is currently behaving. After all
features are reviewed, an overall analysis is provided along with
additional notes and conclusions summarizing the expected outcome for
the future.
Wind Anomalies
Trade
winds over the equatorial Pacific typically blow east to west, towards
the Philippines and New Guinea, stronger during the spring and summer
and less so in the Fall and Winter as low pressure starts building in
the upper latitudes with cold front sweeping south towards the equator. During El Nino years and during the Active Phase of the MJO,
rather than blowing east to west,
they blow west to east, or at least blow less strong than
normal, which has the same effect as a
reversal of trades in that it supports the generation of a Kelvin Wave
(more below). When trades are suppressed, this reduces
the amount of upwelling along equatorial Central America,
allowing the collection of warmer water there (El
Nino).
Conversely stronger than average trades there increase
upwelling producing
cooler than average waters (La Nina).
A
Westerly Wind Burst (WWB) is
an stronger than normal extended duration of wind that blows from west to east along the
equator over the West or even Central Pacific, contrary to normal trade
winds and
forcing warm surface waters to start moving in the same direction as
the wind (details below), a hallmark of a strong Active Phase of the
MJO and a precursor to El Nino. Historically if either El Nino or a
strong burst of the
Madden-Julian
Oscillation is in-effect, trade winds that normally blow from east to
west reverse themselves and blow west to east. That is, when the MJO is
in an Active Phase, the trades reverse themselves in the West Pacific,
and when the MJO is not active, trades return. During El Nino years the the
MJO still has Inactive Phases, just not as prolonged or strong. Conversely during La Nina there are Active
Phases, but they are not as strong or long in
duration.
Analysis from TAO Buoys: Down at the surface the TOA array (hard sensors reporting with a 24 hr lag) indicated modest west winds (not anomalies) from 160E-180W just north of the equator, and moderate in strength over that region further north of the equator on the Intertropical Convergence Zone reaching to 170W. A pocket of 20-24 kt west winds was centered at 7N 148E with 12 kt or grater west winds from 135E to 175E aligned on the 7N latitude line. Anomalies were moderate from the west from 160E to 120W on and north of the equator. This pattern has been in control since 9/2 and has remain effectively unchanged. The anomalous west wind pattern is like a machine at this point and is locked over the eastern half of the KWGA, which is a normal configuration as El Nino matures. Previously west anomalies were steady for a 29 day window (7/19-8/19) and followed directly behind a very strong WWB burst (third of the year) that was associated with a robust Active Phase of the MJO (historically strong) 6/24-7/17 (nearly 2 months of west anomalies or stronger). Since 9/2 this steady Westerly Wind anomaly pattern has been in play from 160E over the dateline and beyond.
1 Week Forecast: Modest west anomalies are forecast from 150E to 150W with pockets of stronger anomalies lasting a day here and there. Overall the strength of these anomalies is to be about similar to the pattern that has persisted for months now, just minus any WWBs. The GFS model depicts steady west winds in the Intertropical Convergence Zone up at 9N (reaching south to 5N) in the 15 kt range holding into Mon (9/14) then fading and gone by Thurs (9/17). Though not in the KWGA proper, the thought is this might end up being a legitimate WWB. Could another Kelvin Wave result? The answer is unknown at this time but for the most part Kelvin Wave development is limited by the Coriolis Effect to a few degrees either side of the equator. A dead wind pattern is to continue forward in the heart of the KWGA. No east anomalies have occurred this year in the KWGA, not one day, and none are forecast.
A huge WWB occurred in March followed by a second smaller one (9 day duration) in early May with weaker but still solid west anomalies continuing after that through 6/10. Anomalies faded to neutral for 8 days through 6/18 as the Inactive Phase of the MJO interfered with the pattern (the first such event of the year), then weak westerlies started again on 6/18. A significant WWB, the strongest of the year so far, starting on 6/26 peaking near 7/4 but held nicely through 7/17 (22 days), the result of a historically strong Active Phase of the MJO which produced a strong and large Kelvin Wave, the third this year and the strongest by far. Moderate westerly anomalies redeveloped 7/29 when a Rossby Wave started interacting with the building El Nino base state, enhancing the westerly flow, developing a mini-WWB at 175E through 8/5. And westerly anomalies continued through 8/19. That is nearly 2 months of non-stop anomalies if not out and out west winds (6/26-8/19). From 8/19-8/25 lesser westerly anomalies occurred and those were mainly east of the KWGA, with dead neutral anomalies in the West KWGA. West anomalies started rebuilding on 8/26 and turned to legit west winds at 9N on 9/3. West wind anomalies at the surface are the hallmark of the Active Phase of the MJO and El Nino and drive Kelvin Wave production. OLR Models: Indicate a weak Inactive signal over the far West Pacific typical of a maturing El Nino. The Statistic model suggests a weak Inactive MJO pattern is to hold over the far West Pacific for the next 15 days. The Dynamic model depicts a weaker version of the same. In essence no MJO influence is forecast. This is typical of the pattern when an El Nino base state strengthens.
Phase Diagrams 2 week forecast (ECMF and GEFS): They suggest the Active Phase of the MJO is dead and collapsed and is to not return.
40 Day Upper Level Model: It depicts a moderate Inactive Phase in the far West Pacific tracking east. In reality, this pattern has been on the charts for weeks now and consistently fails to materialize. It is suspected the stronger El Nino base state is in control, but exhibits an Inactive-like MJO pattern over the far West Pacific, with an Active-like pattern over the dateline and points east of there, but not moving. The model thinks it's a real Inactive Phase in a normal year in the West Pacific and tries to move it east. We are for the most part ignoring this model.
CFS Model beyond 1 week (850 mb wind): A weak Inactive Phase of the MJO is forecast continuing through 9/26 centered at 130E, much like the 40 day upper level chart we are ignoring above. We will ignore this one too. Some positive enhancement from a Rossby Wave is occurring now and is to continue through 9/22 easing slowly west. A push of the Active Phase of the MJO has returned to the charts expected to start 9/29 and holding through 10/22 enhanced by a Rossby Wave in the west during that period. we'll believe it when it happens. and Inactive Phase to follow 11/1-11/26, followed by another Active Phase. Regardless of those oscillations, we believe the El Nino base state is now the primary driver of Westerly Anomalies from here forward into early Dec. No easterly anomalies are forecast. The question is, will another Kelvin Wave result or will the anomalies at least continue to fuel the subsurface warm reservoir into Dec? We'll see. Regardless, by 12/1 the CFS model has westerly anomalies on the move to the east centered at 165W (instead of 180W like now) suggesting the peak of El Nino is expected in the Dec timeframe (from a wind perspective).
Again we are ignoring the supposed Inactive MJO pattern in the far West Pacific depicted by the models. And we're more interested now in constructive interference from a Rossby Wave now in-play in the East Pacific and easing west into early October. A pure El Nino base state is at play driving current west anomalies and not expected to change much anytime soon, or if anything, build. Tropical systems have the best chance of constructively interfering (enhancing) westerly anomalies from here forward. And west anomalies if not out and out west winds, regardless of their source, are all that's required to push warm water to the east. If anything, we're on autopilot now, which is a good place to be. Subsurface Water Temperatures
Another key indicator in the evolution of either an El Nino or La Nina event is the depth and profile of the 20 degree isotherm (thermocline). During La Nina events, warm subsurface water remains pooled up in the far equatorial West Pacific while cold surface and subsurface waters dominate the East Pacific, resulting in a steep angle from east to west, or from a shallow pool of warm waters in the east to a deeper pool of warm water in the west. In El Nino events, warm subsurface water (i.e. Kelvin waves) migrate from the West Pacific to the East and the angle flattens with the depth of warm water becoming more uniform across the width of the equatorial Pacific. The more warm water in the equatorial East Pacific means more storm production in the North Pacific during winter months (roughly speaking). Cold water in that area has a dampening effect. Regardless of what the atmospheric models and surface winds suggest, actual water temperatures are a ground-truth indicator of what is occurring in the ocean.
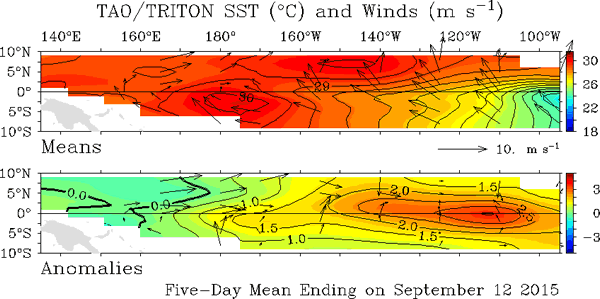
TAO Array: (9/12) Actual temperatures remain impressive. 29 deg temps are between 140E to 145W (easing east some) with a pocket at 30 degs at 170W and holding. Anomaly wise +2.0 degs anomalies are fully bulging from the dateline eastward and +4 deg anomalies cover from 142W eastward (easing east), the direct effects of the massive June-July WWB. A large warm reservoir at +5-7 deg above normal is poised to erupt into Ecuador (leading edge erupting now just west of the Galapagos). That reservoir is holding coverage with peak +7 degs anomalies centered at 110W (easing east some) with +5 deg anomalies extending east from 137W to Ecuador (holding). This pocket is a mixture of warm water from a WWB in early May merging with water from the most recent strong WWB in late June-July. The pipe is open. And warm warm water continues falling to depth near the dateline. Warm waters appears to be erupting in the east with the hi-res subsurface animation (9/5) depicting a complete disappearance of what was a tiny backdraft cool pool (east of) the Galapagos.
Sea Surface Height Anomalies (SSHA): (9/5) It is holding solid depicting 0-+5 cm anomalies over the entire equatorial Pacific starting at 179W (holding) with a core at +15 cm anomalies from 105-140W (shrinking). Anomalies are holding into Ecuador (0-+5 cm) with 10 cm anomalies pushing to the Galapagos indicative of the arrival of the 3rd Kelvin wave. All this is indicative of a wide open pipe with a large Kelvin Wave in flight in the mid-Pacific poised to merge with a subsurface reservoir poised off Ecuador. This is a classic major El Nino setup.
Upper Ocean Heat Content: As of (9/5) this data drives the point home. It indicates +0.5-1.0 deg anomalies are tracking east between 1757 and the Galapagos (expanding). +1.0-1.5 degs are from 159W eastward. +1.5 deg anomalies are doing the same easing east from 154W. All these sectors are holding or easing east slightly. A pocket of +2.0 degs anomalies are at 148W-->95W (building) with a large pocket of +2.5 deg anomalies between 140W-->105W (expanding some). A pocket of cooler 0.5-1.0 degs anomalies is fading fast between the Galapagos and Ecuador (from 86W-80W). The backdraft pool has not completely given up but is fading. A strong Kelvin Wave impacted the Ecuador Coast in May-June with a second somewhat weaker one impacting it in June. And now a third is poised with it's leading edge starting to present over and west of the Galapagos, the strongest of all and getting stronger with each update. A pause in warming near Ecuador occurred starting mid August, suggestive of a break between successive strong Kelvin Waves. But that gap is fading fast now (see below). The subsurface configuration suggests there are 2.5 months of warm water in this reservoir (till Nov 1) and some of that water is extremely warm (8 degs above normal). The peak is forecast to occur roughly on 10/4 in the Nino 1.2 region. And westerly anomalies are building in the ITCZ just north of the KWGA. So the question becomes, is this third Kelvin Wave the final one, or will another follow? We all hope the answer is more is on the way. but that is entirely dependent upon how strong the El Nino base state really is. Historically this is an epic setup. Surface Water Temperatures
El Nino is characterized by a thin stream of warmer than normal surface water temperatures extending from Ecuador west over the Galapagos Islands and onward to a point south of Hawaii or more. As El Nino matures, the water temps increase and cover more area, typically peaking in late December. Conversely La Nina is characterized by the opposite, cooler than normal water temps in the same region and time frames. It is the change in water temperature that theoretically sets up the weather changes associated with either El Nino or La Nina (though we believe that is more a symptom of greater atmospheric and oceanic changes already in play, that enabled the water temp changes to occur in the first place). During La Nina a 'Horseshoe Pattern' pattern can develop characterized by La Nina's cold water pushing west on the equator displacing warm water to the west and positioned both north and south of the cool pool). The Horseshoe is driven by stronger than usual northeast trades winds pushing off the US West Coast and southeast trades tracking off South America deflecting warm water to the west and poleward.
The more warm water in the equatorial East Pacific means more storm production in the North Pacific during winter months (roughly speaking). Cold water in that area has a dampening effect. Regardless of what the atmospheric models and surface winds suggest, actual water temperatures are a ground-truth indicator of what is occurring in the ocean. Satellite Imagery
Low-res: (9/10) Overall the picture is improving. A tiny cool pocket previously just east of the Galapagos is gone. Otherwise a warm water signal covers the entire equatorial Pacific from the dateline eastward. And the pattern is getting better defined and is exhibiting more concentration compared to previous months data. The overall signatures is the strongest of any point so far this year and of any time since mid-July 1997. A huge pool of warm water is covering the entire equatorial Pacific and filling the entire North Pacific Ocean. Temperatures in the NINO1.2 region continue to be of concern (see below). Along the West African Coast, cool water continues there, but not growing any. Very warm water continues off the US West Coast and is building while extending west the whole way to Japan but unrelated to this years El Nino, but possibly attributable to the building warm phase of the PDO. Slightly cool water is over North Australia extending north of New Guinea to the dateline. The cool wake of Kilo is evident off Japan. Warming water continues near Madagascar suggestive of a building Indian Ocean Dipole.
Hi-res Nino1.2: (9/10) Temps continue suppressed here. They crashed on 9/8 and are steady at this time. Water temps dramatically faded between the Galapagos and Ecuador where on 9/6 the warm pattern was looking very solid and approaching peaks set during Kelvin Wave #2's eruption. Unfortunately we have back-slid. There were still patches of +2.25 deg anomalies, but with greatly diminished coverage and mostly +1.75 deg anomalies now filling the area between Ecuador and the Galapagos. We're not as bad as we were in mid-August, but not looking particularly good either in this area. The hi-res chart that depicts temp changes over the past 7 days (9/10) depicts a cooling trend along the Peruvian Coast up to the Galapagos as well. All this speaks to the focus of this event being either 1) westward displaced or 2) just another piece of the upwelling phase of the Kelvin Wave cycle bleeding through the line.
Previously a rapid decline in anomalies started 8/13, reaching it's worst on 8/15 east of 100W with only limited pockets of +2.5 deg or greater anomalies present. This cooler pocket started working it's way west over the Galapagos. But warming from Kelvin Wave #3 started just in time, on 8/23 and built solidly into 9/8, negated any affect previous cooling might have had. But now that warming has retracted. The upwelling phase of the Kelvin Wave cycle is apparently not over. Peak temps occurred between the Galapagos and Ecuador on 7/14, then faded between 7/14-7/30. From 7/31-8/13 temps between Ecuador and the Galapagos stabilized then crashed starting 8/13 finally bottoming out 8/17. A slow warm up started 8/23 and progressed nicely through 9/8 before falling back some. Other Sources
Galapagos Virtual Station: (9/11) This station reported temp anomalies at +3.6 degs. This is up some from +3.1-3.4 degs since 8/31 and up from 2.6 degs (8/28), and back in line with previous readings in the +2.7-3.2 range (8/20-8/26). The trend is steady for now. Previously a solid reading occurred on 5/23 at +4.59 degs suggesting the first Kelvin Wave generated in Jan-Mar had arrived, then built to +5.45 degs on 6/14. Temps faded from that high peak down to +4.1 degs in late June then rebuilt up to +4.94 on 7/17. Then a fade set in, down to +3.1 degs as of 7/31 and bouncing from +3.1-3.5 through 8/7, then falling dramatically to +2.0 on 8/10 and held at +2.1-2.3 degrees 8/14-8/19. Temps built to +2.7-3.2 8/22-8/27 and up to +3.5 on 9/5 then down to +3.2 degs on 9/9.
Hi-res NINO 3.4: (9/11) Unbroken +2.25 degs anomalies continue advecting west from a previous Kelvin Wave that impacted the Galapagos reaching west to 145W. Two pockets of +4 deg anomalies (measured at 5 deg C above normal and building in coverage) are present at 100W and 110W, advecting west. Total coverage of anomalies continues to build except between 145-155W, where anomalies have fallen below +2.25 degs. Previously +2.25 anomalies reached to 133W on 7/16 and then 138W (7/31) pushing to 149W on 8/10 and 158W on 8/15 and filling the area to 160W on 8/18. This is advection west of warm water resulting from eruption of the 1st and 2nd Kelvin Waves earlier this year. And the third one is just starting to present.
TAO Data: +1.0 anomalies are in control over the entire equatorial East Pacific, the warmest in years, advecting west from the Galapagos covering the entire area west to the dateline and beyond (expanding to 172E as of 9/11). We're monitoring the +0.0 anomaly line to see if it's moving east. Today its at 155E (moving west). +1.5 deg anomalies reaching to 177W (no change). There is also a massive embedded area of +2.0-2.5 deg anomalies extending from the Galapagos to 163W (steady) with +3.0 deg anomalies depicted embedded in it from 107W to 125W. Overall the warm water signature is building, and very impressive at this time. We expect more expansion in the next 2-3 months
Nino1.2 Index Temps: (9/12) Temps are falling at +1.558 degs, down from +1.813 degs on 9/10, and +1.981 on 9/8. This falloff is consistent with what is being indicated in the hi-res Nino1.2 imagery. Previously temps hovered at +2.1 degrees early June then spiked reaching +3.0 degs on 7/3, faded, then spiked again on 7/13 at +3.0 degs and yet again at +3.0 degs on 7/22. Temps fell to +1.9 degrees on 7/27 and bottomed out at +1.0 degs on 8/20 at the height of the upwelling phase of the Kelvin Wave Cycle. Then temps started building to +1.3 on 8/26 and +1.7 by 8/29 and to +2.0 by 9/8 before falling recently.
Nino 3.4 Index Temps: Temps are down slightly at +1.718 degs, falling from +1.859 on 9/10. The all time peak for this event was +2.24 degs on 8/23 (one day). By any normal standard we are in Strong El Nino now. The recent falloff is a result of falling temps at 150W (discussed in the NIno3.4 hi-res imagery above). In '97 for Aug the monthly anomaly in Nino3.4 was +2.02 (OISST.v2) The data for this months data (Aug) just posted at +2.06. They are even. For OISSTv.4 its +1.74 ('97) and +1.49 (2015). This months data is just a bit behind '97. Based on what is happening in the Nino 1.2 region, with the 3rd Kelvin Wave apparently starting to erupt there, the thought is additional warming is poised to occur in Nino3.4. Water temps previously held in the +1.0-1.3 deg range since mid-April, then started building pushing +1.5 degs on 6/30, held then crept up, peaking at +1.75 degs on 7/19 and +1.7 degs on 7/29, pushing +1.8 of 8/10 and +2.24 on 8/23.
Special Analysis (9/3): We performed an analysis of Nino1.2 and Nino3.4 weekly anomalies temps using OISST.v2 data. A very interesting pattern emerged: Nino1.2 temps are averaging lower in this years event to date compared to '97, but the Nino3.4 temps are higher. Specifically the Nino1.2 anomaly average for the period 4/30-8/26 for 2015 is +2.42 while in '97 is was +3.43. Meanwhile west of there in the Nino3.4 region, the average for 2015 is +1.49 while it was +1.42 in '97. This suggests the 2015 event is more focused west of the Galapagos as compared to '97. And looking at the Nino4 region, the same pattern emerges. A simple view of SST anomaly charts clearly indicates the same thing. There was much more heating in the Galapagos region in '97, while in 2015 the warmth is displaced more to the west.
If you narrow the focus to just the timeframe July through August the same trend emerges with Nino1.2 anomalies +1.52 degs warmer in '97 compared to 2015 and Nino 3.4 temps almost dead even (-0.03 in 2015).
Regardless, the pattern is emerging that this is a westward displaced El Nino like the 82/83 super El Nino event. This suggests the Walker circulation is not displaced as far east as in '97 but more like '82/83. At this time we're unsure what the effects on rainfall would be. Total rainfall in San Francisco in '82/83 was 38.17" (+16.38") versus 47.22" in '97/98 (+25.43"). The long term average is 21.79". In LA in '82/83 it was 31.28" (+16.47) versus 31.01" in '97 (+16.2"). Long term average 14.81". Regardless, both events were well above average. This also suggests the core of storm production will be north of the most warming. So rather than the Eastern to Central Gulf of Alaska being the focus, it might be more in the Western Gulf. This is actually a good thing relative to California by perhaps giving resulting swells more room to groom themselves before hitting the coast. This might bode not so well for Hawaii, with large stormy conditions the result. Of course, this is just speculation at this time.
The biggest issue is we need to get past the upwelling phase of the Kelvin Wave cycle. We thought we were there, but with todays readings in the Nino1.2 region, it's apparent a little more cool water needs to bleed out of the line. If that is not the case, then the focus of upwelling for the 3rd Kelvin Wave will be west of the Galapagos. But we're not ready to declare that a fact just yet.
Pacific Counter Current: As of 9/3 the current moderate but not overly impressive. The current is pushing strongly west to east over the west equatorial Pacific north of the equator from 130E to 165E, and still solid but fading while pushing west to 140W before fading out at 120W. A stream of weak to modest east current was over the immediate Galapagos reaching west to 120W and then again near 170E. Anomaly wise - moderate west anomalies were spread mostly north of the equator over the West Pacific to the dateline, with a strong pocket north of the equator from the dateline to 140W, then fading with another pocket at 100W. One pocket of east anomalies was indicated south of the equator at 180W. This is not as impressive as the last update. Compared to the '97 El Nino at this time, there is no comparison. In '97 the current was raging east from 130E to 140W mainly north of the equator.
SST Anomaly projections
CFSv2 model - PDF Corrected: For the model run 9/12 for the Nino 3.4 region, peak temperatures for this event have fallen again. Water temps are at +1.75 deg C (verified at 1.6 degs today) and are to fade some to +1.7 degs by Oct peaking at +1.85 degs by Nov, then dropping off. Considering temps in Nino3.4 now and the size of the new Kelvin Wave forming subsurface, we suspect this projection is on the low side. Uncorrected data suggests peaks to +2.6 degs. We'll venture a guess of somewhere around +2.3 degs for a one month peak.
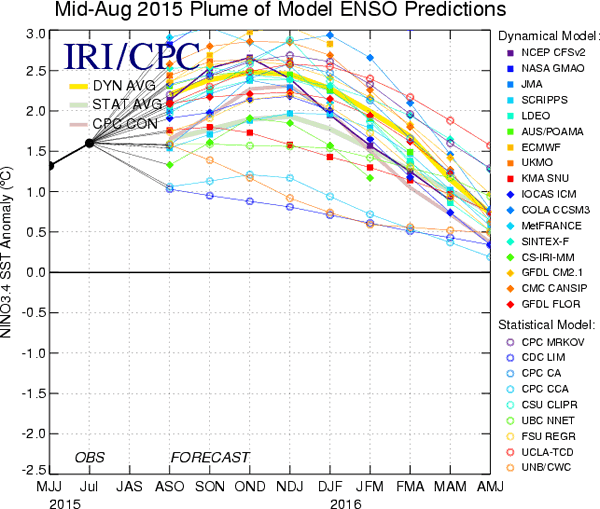
IRI Consensus Plume: The mid-Aug Plume has upgraded significantly, suggesting peak temps between +2.0 degs (Statistical models), +2.5 degs (Dynamic) with the CPC consensus at +2.3. The mid-July consensus was spread between +1.5-2.0 degs. See chart here - link.
If one is to make a direct comparison of the 2015 event to '97 at this time of year based on the areal coverage of water temps, there is no comparison. '97 imagery leaves this years event in the dust. The '97 event built non-stop from this point forward (in terms of areal coverage). Instead, the 2015 event, though warming nicely with comparable to stronger anomalies in Nino3.4 and Nino4, is weak in Nino1.2 and the coverage of warm waters is a worm in this area compared to '97s mammoth coverage. A clear and significant downgrade occurred in the Galapagos area 8/12-8/20 the result of a pause in upwelling of warm water in that region, a break between the first and second Kelvin wave eruptions and the third poised just off Ecuador. The good news is concerns about these cooler waters advecting west and impacting temps in the Nino3.4 region are gone, with regent warming from the 3rd Kelvin Wave already eliminating those cool pockets. And things are just getting started. Peak temps in Nino 1.2 expected 10/4 then advecting to Nino 3.4 on 11/4.
Atmospheric Coupling
These are lagging indicators that suggest how much the change in ocean temperatures are affecting global atmospheric circulation. These do not drive oceanic change but are a reflection of the oceans impact on the air above it.
Southern Oscillation Index
Daily Index: Was rising from -26.00. Of note: The 97 El Nino had daily values at -40 to -50 in early Nov with one spurt to -76 Jan 30/31st.
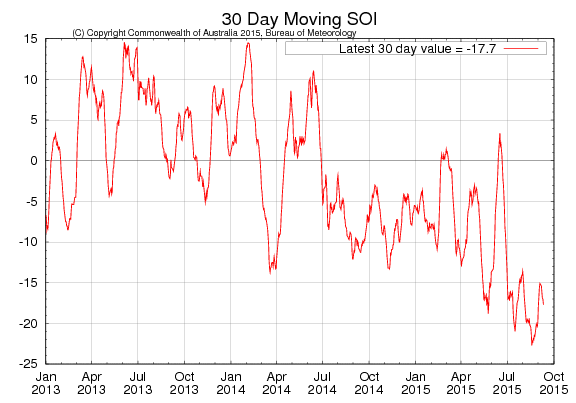
30 Day Average: Was falling from -16.47. The lowest point in years was achieved -20.95 on 8/21, with the previous lowest at -20.49 on 7/18/15.
90 Day Average: Was falling from -17.39 beating the previous peak low. It has been at or below -10.0 since early July and on a steady fall ever since, bottomed out at a low reading on 8/5 at -14.17, then beat it on 9/2 at -15.23, and then again on 9/10 at -16.51 (peak low of the year so far).
Trend (looking for negative SOI numbers, indicative of the Active Phase of the MJO or El Nino): The near term trend based on the daily average was indicative of a building El Nino base state. The longer term pattern was indicative of a steadily building El Nino base state.
SOI Trend - Darwin (looking for high pressure here): High pressure was over Southeast Australia on Sat (9/12) but fading some, only to be replaced by more high pressure Tues (9/15) and holding for the foreseeable future.
SOI trend - Tahiti (looking for low pressure here): A small low pressure cell is to be tracking south of Tahiti Sun-Wed (9/16) followed again by higher pressure into Sat (9/19).
SOI 1 week Forecast: The net result is to be a trend of a generally negative SOI values through Sat (9/19) attributable mainly to high pressure over Australia and a generally low pressure pattern trying to set up south of Tahiti. This is exactly what we want to see, only stronger.
SOI Analysis: During El Nino, the SOI functions as a measure of how well the ocean and atmosphere are coupled. Current numbers suggest good but not great coupling, but getting better footing slowly but steadily (notice the 90 day average trend). This pattern is to only change for the better as the El Nino base state builds as we move into Fall. A consistent 90 day average of -18 is our target, indicative of a strong El Nino.
Other Indices
Southern Hemi Booster Index (SHBI) (which is theorized to supercharge a developing El Nino): A steady south wind pattern is in control and forecast to hold into Mon (9/14), collapse some, then rebuilding perhaps by Thurs (9/17). It is high pressure over Southeast Australia that sets up the southerly surface flow. South and southeast wind anomalies have been in this region off and on for weeks now (previous run 7/29-8/10, this run 8/13-8/18), but not lately. The SHBI appears to only be slightly influencing El Nino development, but we have no hard numbers to confirm.
ESPI (like SOI but based on satellite confirmed cloud cover): (9/12) Today's value was +1.98, up some from + 1.89 on 9/10, down from +2.07 on 9/5 and down from +2.16 on 9/3. The ESPI was steady in the +2.5 range through 8/10, then began falling, to +2.42 on 8/18 and bottoming out at +1.78 on 8/26. It started rebuilding on 8/29 at +1.89. Historically the peak of the '82 El Nino was +2.2 and the '97 event +2.85. This suggests the '15 El Nino is reasonably well coupled with the atmosphere, more so than some of the other indices indicate.
Multivariate ENSO Index (MEI) (Aug) The current ranking is up hard at +2.37 or up 0.39 standard deviations (65). The July MEI was 1.97 SD (65). At this same time in '97 the ranking was 3.00 SD (66) and in '82 it was 1.85 SD (62). So we're between the '82 and '97 events but close to '97, in strong El Nino territory presumably moving towards the Super El Nino range. The top 5 events since 1950 in order are: '97, '82, '91, '86, and '72 with '97 and '82 classified as 'Super El Nino's' because they reached 3 standard deviations (SD) above normal. '91 and '86 were at about 2.2 and 2.1 respectively with '72 peaking at 1.8 SD's above the norm. We've already beat all those. Suffice it to say we are somewhere between '82 and '97 in term of of atmospheric coupling per this index. Most impressive.
North Pacific Jetstream (9/12) A steep trough was over the dateline reaching down to 27N with 100 kt winds flowing down into it. Otherwise 130 kt winds were flowing up the coast of Japan forming a ridge there before falling into the aforementioned trough, then rebounding and tracking east at 140 kts into British Columbia. This is mildly interesting but not impressive at all. The trough is to get fully cut off on Mon (9/14) and circulating on it's own before dissipating on Tues (9/15). A split flow is to evolve in the west by Wed (9/16) merging over the Gulf. And by the weekend a weak Fall pattern is to try and set up, with the jet looking more organized and displaced south at 40N over the bulk of the Pacific by Sat (9/19). .
Analysis
In late 2013 into 2014 the Active Phase of the MJO and successive Kelvin Waves warmed waters over the Eastern equatorial Pacific and primed the atmosphere out of a 15 year La Nina biased pattern that had been in play since the demise of the '97-98 Super El Nino. It is assumed some greater force was dictating the change from a cool regime to warmer pattern, (the PDO). This warming and teleconnection continued building in 2015 with two Kelvin Waves arriving in Ecuador warming surface waters well into El Nino territory and a third, the strongest so far, starting to erupt in the Galapagos region. At this time we believe the classic El Nino feedback/teleconnection loop is in effect, with the atmosphere and the ocean well coupled.
The 2015 El Nino pattern continues to build in fits and starts, but is hampered by 'The Pause' that occurred in August and continues in Nino1.2 today (9/10). In spite of that, El Nino continues to move forward. Temps in the Nino 3.4 region today are solid and expected to only build as the leading edge of massive Kelvin Wave starts erupt over the Galapagos. Still the focus of that eruption right now is west of the Galapagos. The big question remains concerning how strong will this El Nino become. In the end, strength is a function of the temperatures in the Nino3.4 region. The warmer the core temps and the larger their areal coverage, the more influence on the jetstream. Obtaining high Nino3.4 temps is a function of the strength and duration of westerly anomalies in the Kelvin Wave Generation Area. And the frequency of those events is dictated by the 'character' of the El Nino. The '97 event was a bulldozer, developing out of a previous cold La Nina water state, and never looked back. Contrasting that was the '82-83 event, which didn't even start presenting until the Fall. The 2015 event presented originally with a false start in 2014 (and for that matter another false start in 2012), and has taken it's sweet time getting organized since then, in fit's and starts. We suspect it is struggling against an atmospheric biased towards La Nina forced by a 15 year run of the cool phase of the PDO. But we believe the atmosphere is now transitioning to the warm phase of the PDO, but is still fighting some previous momentum from the cool phase, hence elongating this El Nino's lifecycle. Regardless, a large and strong Kelvin Wave, the largest of this event is starting to erupt now. It will take at least 3 months for the tail end to erupt over the Galapagos and advect through the Nino 3.4 region. So assuming peak heating in Nino1.2 occurs on 10/4, it will be 11/4 till that peak warmth reaches Nino3.4. And that might even be optimistic.
The longer El Nino threshold temperatures persist, the thought is the longer it will take proportionally to dissipate. That is, the sooner warm water temps develop, the sooner they will have an effect on the atmosphere and the more momentum El Nino will have on the atmosphere, and will therefore take longer to dislodge. The atmosphere responds very slowly to change. but once changed, it doesn't turn back to it's previous configuration quick either. An official El Nino was declared in late 2014 and has only gotten stronger since then. If westerly anomalies continue as predicted by the CFS model, and another Kelvin Wave results (starting say 11/1), it would not arrive in Ecuador till ~Feb 1, 2016, and not disburse till a month later (March) that would mean a total duration of El Nino temps in the Nino3.4 region of 17 months. That said, the character of this event is not at all like '97 (which was brisk paced and steady), but not at all like '82 either (which developed even later and faster). This one is a slow moving train wreck. That would not be a bad thing, in that it could slow the inevitable transition to La Nina until later in the winter of 2016-2107.
So where does it go from here? Having a MEI (July & Aug) that is equivalent to two other El Nino that eventually turned into Super El Ninos is no guarantee that this years event will eventually evolve into a Super El Nino. We still have 0.63 SDs to go. But given the current warming in the west quadrant of Nino1.2 now, that seems like a pretty easily obtainable goal. And looking at the record back to 1950 for other events that have similar values in July & Aug, the odds favor that outcome. With an evolving El Nino base state in control and building, it seem more warm water transport east is inevitable. And we haven't even hit the Fall season switchover, which tends to supercharge westerly anomalies during El Nino years. The future concerning more and stronger WWBs is unknown, but we are betting on the CFSv2 being largely on the right track with the El Nino base state slowly having greater influence over time and being enhanced by Rossby Waves at times.
So for now we're tracking towards an El Nino that will end up somewhere between the 82' and '97 event, with very good atmospheric momentum in play. We'll continue monitoring the North Pacific jetstream and will be looking for tropical activity in the West Pacific to recurve northeast moving towards the Gulf of Alaska, and for swell to result from such systems in Sept. To us, those are the sure signs of deep changes in the atmosphere influenced by El Nino. Typhoon Atsani did not live up to the hype. And Kilo is not going to do it either. And the jetstream charts are not impressive. All data to date regarding the character of this years event, depict it as a slow mover. As such, any direct influence from El Nino will probably occur alter in the Fall rather than earlier. Regardless, continue your training routine.Once the storm cycle starts, we expect it to only build in momentum, consistency, and intensity, peaking in the Feb timeframe.
Typically La Nina throws all it has
into it's first year of existence, and by the second year, it is
fading, and is normally just a ghost of it's previous
self. Typically the worst time for storm production is
during the second year of a 2 year La Nina, especially in February
as it is moving into the Spring Predictability Barrier and likely
getting ready to turn towards an ENSO neutral or El Nino favored
long term outlook. This is because there is little energy left in the
atmosphere, where it has almost reached a state of equilibrium. It
is at the extremes of the ENSO cycle (strong El Nino or strong La Nina)
where North Pacific Storm formation is at it's best (and of course
always favoring the strong El Nino). But as things settle down and things
move into the no-mans land of a transition towards equilibrium, a
rather stable pattern settles in.
LONG-RANGE NORTH PACIFIC STORM AND SWELL GENERATION POTENTIAL FORECAST
Fall/Winter/Spring
2015-2016 Swell Generation Potential (for California & Hawaii)
= 7.8
Rating
based on a 1-10 scale: 1 being the lowest (small and infrequent winter
surf conditions), 5 being normal/average, and 10 being extraordinary
(frequent events of large long period swells)
Methodology (2010+) :
We
are using the same methodology for making long term
predictions since 2010. In
the past we looked solely upon the presence El Nino using the approach
that El Nino typically enhances the size, strength, frequency and
duration of winter North Pacific storms in and around the Gulf of
Alaska, thereby improving the likelihood for large winter surf in
California and Hawaii. And that La Nina typically decrease the size
strength, frequency and duration of such systems. After reviewing
data from many such years, we still believe that to be true in an
absolute sense over the course of an entire season, but also now
recognize that the lingering effects of either a strong El Nino or
La Nina event last far longer than previous suspected (up to 1 year).
So in the Fall and early Winter season directly following a strong El
Nino winter, even though La Nina may be in effect, the lingering
effects of El Nino on the upper atmosphere could have an enhancing
effect on net storm activity. We've are also turning towards the
opinion that strong La Nina events can potentially have enhancing
effects
on net North Pacific storm formation during the Fall
season. The net effect is the more extreme the
divergence away from a neutral state, the greater the propensity for
weather systems to try and return the system to a state of equilibrium
in the form of storms (which create winds and therefore waves). In the
El Nino state, the focus of the storm is centered more upon the
dateline and the Western Gulf of Alaska and the storm track falls south
and lasts longer into the winter season, where in a La Nina scenario
the focus is more on the Eastern Gulf of Alaska with the track being
displaced to the north and timed more on the Fall and early
Winter. Therefore, as the swell source
moves east, Hawaii becomes a less likely target. Conversely,
a relative minimal ENSO or MJO signal suggests little energy in
the atmosphere, and therefore little energy available to force storm
development.
Also
the relative strength of MJO phases have an impact on the transport of
tropical moisture from equatorial regions of the West Pacific northward
to ultimately fall under the influence of the jetstream, increasing the
probability for storm formation moving over the dateline and into the
Gulf of Alaska. So MJO patterns are now considered in the forecast.
In
addition we are become more convinced there is a teleconnection between
storm activity in the southern hemisphere and that in the north 6 months
later. That is, in years where the net storm activity is up in the
southern hemisphere winter (summer in the N Hemi), a corresponding
increase in activity could also be noticed in winter in the northern
hemisphere (6 months later). The only exception is when there is a
strong El Nino or La Nina up north in the winter, then that translates
into a net increase in winter activity in the southern hemi 6 months
later. Most of this focuses on the strength of the MJO, and seeing how
the area it directly impacts is the equatorial Pacific which straddles
both the north and south hemisphere's, it would seem reasonable to have
an impacts at both poles. And
yet one more possible early indicator is the configuration of the
jetstream over the North Pacific starting late July into August over
the North Pacific. There is some evidence to suggests a healthy
consolidated flow over the NPac early in the Fall season might lead to a
continuation of that pattern through the Winter season, and
that if an early season split pattern develops, it will continue in that mode through Winter and Spring. A split
Northern hemi jetstream does nothing to support surface level gale
development.
Forecast Conclusion: All
data suggests we are in a strong El Nino state, possibly moving towards Super El Nino status with no evidence
of La Nina available. For the past 5 years, since the last moderate El Nino of 2009-2010, we had been in some form of La Nina state enhanced by the negative/cool phase of the Pacific Decadal Oscillation. In fact, the cool phase of the PDO has likely been a controlling influence since the last major El Nino of 1997. or for 17 years. Now, data suggests the PDO is reversing direction, moving towards a long term configuration that would support more and stronger storm development in the North Pacific during Fall and Winter months, and would generally reduce net tropical activity in the Atlantic. Since the PDO runs on decade long timescales, it would not be unexpected to see this change take root and flourish over the next 15-25 years. But that is certainly a leap of faith at this early date. It will not be for 5+ years before one could begin to definitively say that such a change is actually occurring. Regardless, the current situation is vastly improved respective to the Pacific and specifically Hawaii and west facing shores of the Americas (North and South) from anything that has been in-play since 1997. And that year turned out to the the strongest El Nino on record (at least in the satellite era) having barely bested the Super El Nino of 1982-83. Defining Super El Nino can be a slippery slope, depending on what yardstick one chooses to use. We're choosing the Multivariable ENSO Index. And there is little argument that the 82-83 event and the 97-98 event are the gold standard against which all others are compared. Of course, prior to 82-83, ENSO cycle was little documented and not clearly understood. It was damage inflicted by the 82-83 event which generated congressional support for funding of the TAO buoy array and other methods to start operationally monitoring for the presence of El Nino. As so here we are 33 years later fully decked out with a wealth of sensors in place to monitor what could possibly a third Super El Nino in a relatively short time span. And as a result the public is much better informed and educated, with all corners of the global economy preparing and poised to react to this potentially significant event.
Three
other discussion points: Despite all the data and indices suggesting a major event is underway, the absolute gold standard for indicating atmospheric coupling, the NPac jetstream, remains unimpressive. It was actually
fairly well positioned in late June with good wind velocities for the time of year, but then fell apart. We suspect the strength of the jet at that time was not so much a function of ocean changes that occurred this year, but were the result of the failed El Nino attempt of last year (2014-2015). As we move deeper into the Fall months of 2015, the expectation is the significant ocean changes currently underway will become more fully reflected in the atmosphere. The nature of this years event has been one of a slow and halting but steady progress. That is in stark contrast to the '97 event, which was very deliberate and linear. Regardless, the warmth occurring in NINO3.4 will eventually be reflected in the atmosphere and the jet will respond in kind.
The apparent westward displacement of the core of warming in this event compared to '97 which was very focused close to the coast of Ecuador is of note. This makes this years event more similar to '82-83, which was also somewhat westward displaced. Make no mistake, we are not referring to anything that resembles an El Nino Modoki event. This is just a slight shift west of the core of warming. The eruption site of the 3rd Kelvin Wave (near 100W versus up along the coast of Ecuador at 80W) is a testament to that shift. This is not problematic, and if anything might be beneficial, meaning those erupted warm waters have less distance to travel and less odds of cooling (due to mixing) to reach the NINO3.4 region. But we're still early in this eruption, and the situation could change. This in turn will affect the region where storms traveling through the North Pacific will be strongest, displacing that location also to the west some. Best guess puts that region between the dateline and the Western Gulf of Alaska, versus being in the center of the Gulf as was the case in '97. This will actually enable swells generated in this location more room to unwrap and groom themselves. and perhaps eliminate some of the stormy character that was they hallmark of swells in the '97 event.
And finally the so called ' Blob' of warm water that has been in play over the Eastern half of the North Pacific, and more so along the US West Coast for 2 years now. We remained unconcerned. Much of that warmth is related to a marked lack of wind in the area, reducing mixing and upwelling, enabling the sun to warm surface waters. Another factor is the aforementioned shift in the PDO. The Blob is a typical response to the change in the PDO, to have warm water build along the Pacific Northwest Coast. As has already been evidenced by the affects of Typhoons Atsani and Goni in the far West Pacific, they cut a very cold track through that warmth in no time. As the Winter storm track evolves, those storms will generate copious wind and quickly mix surface waters with cooler waters at depth and cut a profuse cool track through those sun warmed summer waters. If anything, those waters should provide fuel for storm development as cooler air starts migrating off Siberia, driving that warm moist tropical air to heights, causing cyclogenesis. All we're waiting for is the jetstream to provide the fuel to start the proverbial fire.
Historically
during decent El Nino years tropical systems in the West Pacific
turn hard east, transitioning to extratropical status
and build while moving over the dateline towards the Gulf.
In
the super El Nino of '97, the first Significant class storm of the
year occurred in mid-Sept, an extratropical cyclone resulting in 65 kt
winds over a large area aimed east producing swell of 10 ft @ 25 sec
solid hitting the California coast on Sept 27. And lesser
northwest swell producing systems had occurred as early as
mid-August. And even in the El Nino of 2009, the first significant
class swell of the season arrived on Sept 12th.
Down
south, over the southern hemisphere winter (Northern Hemi Summer), net
storm activity was well above normal with at least 6 significant class storm resulting radiating to Hawaii and California. And the focal point for those storms development was clearly the New Zealand swell corridor, aided by high pressure over Southeast Australia and New Zealand (driving the Southern Hemi Booster Index). All this is evidence of classic El Nino formation. If anything, this summers setup was more the affects of last years failed El Nino bid. We expect the Southwest Pacific to be even more active next summer (2016).
So for now we stand poised for at least a historically strong El Nino, if not an out-and-out Super El Nino. This is about as good a situation for large swell development as could be expected. We're just waiting for the final pieces to fall into place (3rd Kelvin wave eruption, jetstream to respond, and possibly another WWB as we move into the deep Fall period).
We
have assigned a swell potential rating of 7.8 for the coming
Fall/Winter season,
suggesting a historically strong Winter
swell production season. We are holding some of the rating back pending seeing final results of the 3rd Kelvin Waves eruption. We expect the best odds for swell production to
occur in the January-February timeframe, historically the
peak window for North Pacific storm and swell production.
With luck the season could hold into April or beyond, dependent upon how El Nino actually evolves.
During
El Nino events the standard swell profile is for not only more
storm frequency, but stronger and longer lasting
ones producing larger and longer lasting swells. And with the jetstream
shifting south, the swell angle tends to turn more westerly.
Such a pattern was in abundance during the glory
days of the 90's and early 2000's.
Conversely the abysmal surf pattern of 3 year
period between 2006/2007-2008/2009 (the 3 years after the 2005-2006 El
Nino) and the 5 year period after the 2009-2010 El Nino (through 2014). in where we would get one day, or
even 12 hour swell
events, was marked by the presence of La Nina.
For
this year we expect a slow start to the season as we wait for the jetstream to fully come on-line. But once it configures itself in an El Nino pattern, the expectation is for a well above normal pattern, with
solid swell durations with smaller than normal breaks
in-between, and picking up continuously into the Jan-Feb timeframe. New storm and swell activity should be up compared to anything other than '97. Activity is to be most pronounced when the El Nino base state pulses, increasing the coverage of Westerly Anomalies in the West Pacific. Given the anticipated westward displacement of the storm generation area, it is possible Hawaii could experience rawer swells of a more stormy nature, where California could have somewhat cleaner conditions, at least before January. Lingering high pressure from previous years of La Nino might also play into this, with the ridge over California being the last to fall. But once it does, then stormy conditions will prevail, first over the Pacific Northwest then working their way down into even Southern CA.
During El Nino years the surf
strategy is
to plan for the
long run, with endurance and stamina month after month outweighing
short feasts and 'go-for-broke' assaults. Conversely during a La Nina winter one should
get all you can while you can, cause the odds of it occurring
anytime soon are low.
This year one should follow the El Nino strategy, with tactical assaults and picking swell based on conditions and a focus on safety paramount.
Regarding local weather in CA: During El Nino years one
expects more moisture than normal with increased snow pack levels
in higher elevations of the
Sierra on into Nevada, Utah and Colorado. El Nino tends to shift the
jetstream southward and flat over the continental US with the
California high pressure system retreating south and west more
than normal if not evaporating completely, favoring
precipitation for the more southerly positioned ski resorts in the
Southwest. But it too causes surface temperatures to rise with a larger
amounts of warmer tropical moisture in the mix, meaning the
freeze line rises (in elevation) with increased odds for
rain at lower lying resorts. But for La Nina years, the
California High pressure tends to take over the waters off the coast
there with the jetstream focused on the Pacific Northwest (Central
Oregon northward). It is not unusual to have much larger volumes of
moisture up there if not outright flooding while a virtual lack of
rainfall occurs down into California, especially from Monterey Bay
southward. The exact north-south position of the dividing line varies
significantly from event to event. Of
note, during La Nina years, when moisture does move into the California
region, and assuming there is sufficient snow base, there is a higher
than normal tendency for it to be driven by backdoor fronts, those
tracking directly down the Pacific Northwest coast. They tend to
be colder and drier, and when they do arrive, the snow quality is
exceptional with bone dry power the result. They are not common, and
like the surf profile, come only occasionally. So the strategy during
such events is to get it when it comes and not expect more to follow
directly.
For
the 2015-2016 season, expect more precipitation than
normal, but with a later start to the snow and rain season (pending activation of the jetstream). High pressure
has ruled supreme off the CA coast for a very long time, and even with a strong El Nino in-play, it will take a bit of time to dislodge it. But once it's gone, the expectation is the flood gates will open. But as mentioned above, El Nino rainfall events typically are warmer than normal with higher snow levels. Plan accordingly.
As always, this
is a
preliminary assessment, based on what is known at this time and does not guarantee any particular outcome.
And there
remains the nagging question of whether we have
moved into the Active Phase of the Pacific Decadal Oscillation
(PDO). The PDO is in-effect a 20-30 year cycle of weather than
slightly mirrors El Nino in the active phase and La Nina symptoms in
it's inactive phase. Our thinking is that we have been in Inactive phase of the PDO (probably since 1998, and by all rights should stay there for at least 20 years), but perhaps are starting the shift to the Active Phase. If this is true, then odds for favorable winter storm generation
conditions would be stacked more in favor of El Nino than La Nina, since the
Active phase of the PDO mimics a weak El Nino. But this is mostly
just pure speculation. And there is other data that suggests that
we we're only been in a 'corrective pattern' since the big 97/98 El
Nino. Since that ENSO event was so large and strong, the atmosphere had
been trying to re-establish some form of equilibrium for nearly a decade
since, and the 2009/2010 season was the first chance since then for a normal pattern to
manifest itself. Our thoughts are the historical record is too
short and it too soon to know with any certainty whether we
are in a down or up phase of the PDO. But the trend has certainly not been favorable of storm production for years now. Maybe we are due for a favorable change.
The other thought the is though we have not been in a true
La Nina state the past few years, we might have been in a 2 year run-up to a slightly
warm state starting in 2012, perhaps a Modoki state, as part of the run up to the true El
Nino that is developing now. This is the preferred option. A slow but steady
run-up to an El Nino sets the entire atmosphere in motion slowly moving
towards El Nino, and builds much momentum year to year, significantly
enhancing the storm track and net storm activity both in summer and
winter but without all the negative affects of a full blown El Nino.
There is limited evidence to suggest that was in-fact occurring. A few False Starts to El Nino typically result in such a
configuration. and that is what happened in 2012 and then again in 2014.
We calculate net storm activity
will be
much elevated compared normal over the Fall-Winter season with the best
support for storm formation occurring during
active pulses of the El Nino base state in the Jan-Mar 2016 timeframe. In that window
swell producing
Pacific storms will be more frequent that normal, will be longer in duration
and stronger in intensity
with the potential to cover a larger than normal surface area,
resulting in larger than normal sized fetches of longer duration
and intensity. This should result in
statistically larger surf, of more consistency and
longer period with each swell lasting longer than normal. And
swell direction will be displaced to the west (285 degs
relative to NCal/290 degree SCal).
Prior
to the Jan-March 2016 timeframe, a slow but steady increase is expected in terms of the
number and intensity of storms, all attributable to the maturing El Nino base state. If anything, the
7.8 rating is likely on the low side of the scale. Will adjust as we see the NPac jetstream come on-line.
Over
the long term, we're looking for a marked increase in Westerly Wind Anomalies in the eastern Kelvin Wave Generation Area, with a slow but steady eastward migration of those winds into late Winter, with the surface warm pool eventually collapsing and enhanced trades and upwelling taking over the Nino1.2 region by May or so. Even at that, atmospheric momentum should be well entrenched with no signs of La Nino becoming evident till maybe Dec 2016. And even at that, a very wet pattern should prevail well into the winter of 2016-2017 relative to California, and markedly colder. This should favor the Sierra snow pack, especially at lower elevations.
(This
forecast is highly speculative and based on historical analysis of past
La Nina/El Nino events and the latest long-range forecast models)
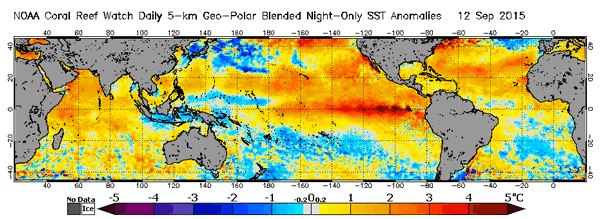
Sea Surface Temperature Anomalies
Courtesy: NOAA OSDPD
(Top image) Notice a clearly defined are of warmer than normal waters stretching from Ecuador to the dateline over the equator. This is a classic El Nino signal. The hi-res image (lower image) clearly indicates upwelling of +4-5 degs anomalies between 95-120W, the result of the start of upwelling of the third Kelvin Wave this year. Notice that it is westward displaced and not erupting between the Galapagos and Ecuador. Also notice very warm water off the US West Coast. The tracks of Typhoon Goni and Atsani are responsible for the cooler trail northeast of Japan. Kilo is responsible for the cooler train southeast of Japan.
NOAA CoralReefWatch
.
Sea Surface Temperature and Surface Wind Anomalies on the Equatorial Pacific
Courtesy: NOAA PMEL
In the top image notice trades wind blowing firmly west to east near the dateline and just over a north of the equator (reverse of normal trades). In the lower image notice westerly anomalies are in control over the equator from west of the dateline (160E) to 130W north of the equator. This is all associated with a building El nino base state. No MJO or Rossby Wave activity is present.
|
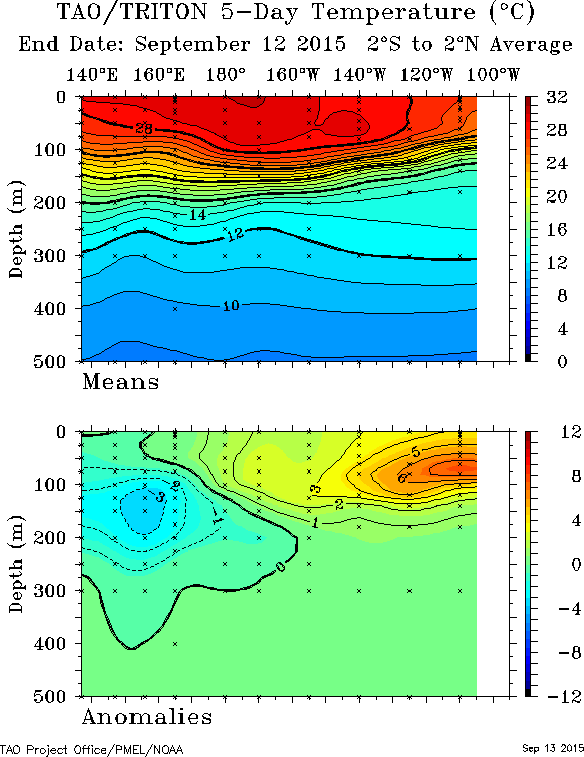
20 Degree Thermocline Depth and Position Time Series
Courtesy: CPC NCEP NOAA
(Top Image) The core of warm subsurface water is centered just east of
the dateline and making good progress to the east with the 28 deg isotherm at 125W. This appears to be in sync with where Kelvin Wave upwelling is occurring.
(Middle Image) Notice the large pocket of much warmer than normal water (7.0
degs C above normal) at 110W and 75 meters deep. This pocket is
the largest and strongest Kelvin Wave so far this year (#3). This one is starting to erupt just west of the Galapagos now generating much warming at the oceans surface.
(Lower Image) Heat anomalies in the upper 300 meters of the oceans surface for the past year. Notice 2 weak Kelvin Waves last year, and 3 stronger ones this year, the strongest of which is occurring now.
NOAA CPC
Equatorial Pacific Sea Surface Temperature Forecast
Courtesy: NOAA/NCEP
Notice that the average of many separate runs of many
models generally suggesting continued warmer of
surface waters in the NIno3.4 region (120-170W) expected to 2.3 degs above normal in December suggesting development of a Strong to Super El Nino.
.
Southern Oscillation Index (SOI)
Courtesy: BOM
The SOI depicts the difference in pressure between Tahiti and Darwin
Australia.
When it is consistently negative (that is surface pressure is lower in
Tahiti
than Darwin Aust), the trend is towards El Nino. And when it is
positive
the trend is towards La Nina. Notice the generalized trend of a falling index since Jan 2014, with the 30 day average now down to -17 and clearly in El nino range. Small pauses or fluctuations in
the trend occurred as the Active
and Inactive pulses of the MJO move over the West and Central Pacific
at 30-45 days each. Dips are the Active Phase
of the MJO and rises are the Inactive Phase.
|
Pacific Countercurrent Anomalies
Courtesy: OSCAR/NOAA
This image depicts the zonal flow of the Pacific Counter current, which
runs roughly on the equator between the West and East Pacific. The top
panel depicts the absolute flow of the current. When it runs east
to west as it normally is (blue arrows), this means nothing, unless is
is strong, then that suggest La Nina. When the flow reverses and
moves west to east (red) that suggest El Nino. Clearly the trend is that of EL Nino, though not as strong as 1997.
The
bottom panel depicts anomalies in the current as compared to
historical and seasonal averages. Departures from normal
are clearly obvious, with strong red arrows reflective of El
Nino and strong blue of La Nina. The images suggest a moderate to strong El Nino/Westerly Wind Burst signal occurring.
|
Multivariable ENSO Index
Courtesy: NOAA ERSL
This image depicts the comparative strength of this years El Nino to other major El Nino's of the past 60 years. Clearly this years event is tracking favorably to the Super El Nino events of 1997 and 1982. To reach Super El Nino status, this years event must reach a Standard Deviation of +3.0. We are 0.63 Std Devs off that mark now.
|