Moderate
El Nino In-Control
Waters Warming - Atmosphere Yet to Respond
Note:
We apologize for the long time between updates to this section
of the site. There really hasn't been much occurring with regards
to ENSO until now so we've focused on coding new
content.
Starting
in May the first signs of a potential El Nino
materialized, then proceeded to build and fade cyclically through
our last update mid-August. Since then a major building cycle
occurred in the month of October, but has again relented. All
this is tied to the cyclical active and inactive phases of the
Madden Julian Oscillation (MJO) and has produced a net buildup
of warm waters over the equatorial regions of the Eastern Pacific
typical of an El Nino event. But the anticipated swell enhancing
effects on the atmosphere above have yet to become manifest,
though certainly expected over the coming month or so. The paragraphs
below describe the evidence that leads to an El Nino conclusion,
followed by an assessment on it's impact on surf in the future.
First
we look at the Southern Oscillation Index (SOI). This number
compares surface pressure over Darwin Australia with pressure
over Tahiti. If this value is negative that indicates
average surface pressure is lower over Tahiti and higher over
Darwin, symptomatic of El Nino (wind flows from high pressure
towards lower pressure). When it's positive, the reverse it true
with higher pressure over Tahiti and lower pressure over Darwin,
typical of La Nina. The first 5 months of 2006 recorded a
string of nearly consistent daily positive values. But starting
May negative values crept into the record with occasional
8-10 day runs of reasonably deep negative values (-20 or so).
By late June almost all the daily values were negative and
continued that way into August with a rather deep spurt
noticed early August with daily values down to the -50 to
-60 range. Then things relaxed late August through September
only to dig deep again starting October 1 and held through
the end of the month when the 30 day running average dropped
to -15, the same as it did the end of August. These values are
not extraordinarily low but certainly not normal, indicative
of moderate El Nino conditions. November has been a mixed month
with some negative and some positive values, all netting out
about near 0 or neutral. The downward bursts in the
SOI are attributable to the active phase of the Madden Julian
Oscillation, which are the building blocks of El Nino and can
be traced to periods of enhanced storm activity in regions where
the MJO passes (more details below). Prolonged neutral
and positive values are symptomatic of the inactive phase of
the MJO.
Looking
at current seasonally adjusted equatorial Pacific Sea Surface
Temperatures (SST), the affects of the past 5 months of
overall negative SOI values are apparent. A well defined tongue
of warmer than normal water is strung along the equatorial Pacific
starting on the dateline and building as it approaches
the coast of Ecuador. Temperatures are up to 2° C
above normal, which is respectable and worthy of notice. The
strongest pocket of these waters is over the intersection of
the equator and the dateline with lesser temps tracking towards
the South American coast but averaging 1.5° above normal.
This is a marked improvement from even 3 months earlier when
a classically well defined warm pool was not really in.cgiace
yet, but is now. During El Nino events warm waters from the far
West Pacific start migrating east along the equator in response
to a shift in the SOI and are blown there by a reversal of trade
winds (more to follow). The South Pacific is near normal other
than a small path of warmer than normal water east of new Zealand,
and up north normal waters temps are occurring over the bulk
of the North Pacific. Latent heat energy remains present over
the entirety of the North Atlantic as it has for several years,
including the Cape Verde storm corridor
(from West Africa due west into the Caribbean Sea), but did not
seem to.cgiay a role in the late season tropical storm season
for that region.
Wind
anomaly analysis indicates near normal winds
currently occurring over the entire length of the equator,
but that was not the case until recent. An extended
reversal of trades started in early October consistent with
the fall in the SOI as the active phase of the MJO took hold,
blowing west to east on the equator over a mult.cgie week
duration in October strong enough to qualify as a certified Westerly
Wind Bust (WWB), a hallmark of the active phase of the MJO and
a precursor to El Nino. The warmer than normal waters currently
running over the equator in the East Pacific and into Ecuador
are a direct testament to the October WWB event. Historically
if either El Nino or a strong burst of the Madden-Julian Oscillation
is in effect, trade winds that normally blow from east to west
reverse themselves and blow west to east.
That is, when the MJO is in an active phase, the trades reverse
themselves in the West Pacific, and when the MJO is not active,
trades return. During La Nina, trades blow much stronger than
normal. We are currently in an inactive phase of the MJO with
normal trades in.cgiay. But
the warmer than normal waters occurring in the East Pacific remain
as solid evidence of the active phase of the MJO from just a
month ago and have pushed up the intensity of the El
Nino pattern.
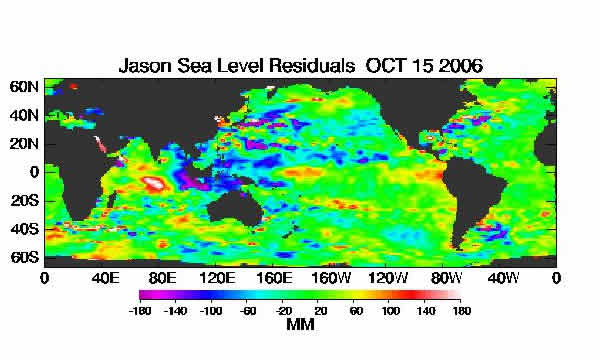
Another
indicator of El Nino or La Nina is a change in sea surface height.
Sea surface height is the height of the oceans surface relative
to 'average'. No current data is currently available.
Another
key indicator in the evolution of either an El Nino or La Nina
event is the depth and profile of the 20 degree isotherm (thermocline).
During La Nina events, warm subsurface water remains pooled
up in the far West Pacific near the equator. Cold surface and
subsurface waters dominate the East Pacific, resulting in a steep
angle from east to west, going from shallow in the east to deep
in the west. In El Nino events, as warm subsurface water (i.e.
Kelvin waves - more below) migrate towards the eastern Pacific,
the angle flattens and becomes more consistent across the equatorial
Pacific. Latest data indicates a solid pocket of warmer
water is being transposed to the East, pulled away from the tropical
West Pacific and currently sitting under the equator due south
of California. These waters
are 5° C above normal and are tracking towards the South
American coast, and direct product of the Westerly Wind bursts
of October. Once they hit there, a major warm upwhelling is expected
and surface water temperatures will likely head up. Compared
to a year ago there's a significant difference in the incursion
of warm water eastward into the South American coast. This is
consistent with the development of a moderate El Nino approaching
the mature phase.
A
Kelvin Wave is a pocket of warm water that travels under the
oceans surface from west to east at a depth of about 150-200
meters. It is generated by a burst of strong westerly winds blowing
over the equator (a.k.a. Westerly Wind Burst (WWB) in the West
Pacific associated with the MJO. As the warm surface water gains
eastward momentum, it sinks near the dateline and travels well
under the oceans surface, only to reappear at the surface when
it impacts the South America Coast. This results in the sudden
appearance of warm waters along the coast of Peru and Ecuador.
Occasional eruptions are normal. Large and consistent eruptions
are the hallmark of solid El Nino events. The source of Kelvin
Waves, a negative SOI and reversed trades is directly related
to the strength and frequency of the Madden Julian Oscillation
(MJO). This weather pattern is responsible for the periodic strengthening
of the anomalous westerly winds in the West Pacific which drive
production of subsurface Kelvin waves, and also drive the SOI
negative. When the MJO enters an active phase, El Nino indicators
strengthen, and as it fades, so does El Nino. Currently
there is a solid Kelvin Wave in flight positioned under the equator
south of California en route to Ecuador as mention above. This
is definitely the most impressive one so far from this El Nino
event.
As El
Nino events unfold at the oceans surface, precipitation will
develop in the atmosphere above the warmer surface waters, since
warmer water supports higher condensation rates above it. The
presence of consistent precipitation where it historically shouldn't
be is a hallmark of El Nino. Current satellite data indicates
minor increases in precipitation just west of the dateline but
nothing else of interest in the greater Pacific. Of note, major
increases in precipitation are developing in the Western Indian
Ocean, possibly consistent with the start of a new active phase
of the MJO. (The MJO travels against the grain of the equator
from west to east developing initially in the Indian Ocean).
Reviewing
all the data, it is clear that an El Nino event is occurring.
The SOI has been negative in bursts over the past 6 months
and has not ventured at all up into the positive range for more
than a few days at a time. Warmer water is in.cgiace over the
entire Eastern Equatorial Pacific with a significant Kelvin
Wave poised to impact the South American coast in the next few
weeks. And it is likely another active Phase of the MJO is starting
to develop in the Indian Ocean. This suggests a moderate El
Nino is occurring and should continue through the Winter/Spring
of 2006/2007. What is interesting is that this El Nino event
started to develop later in the year than when most historically
form. It is unclear whether this means the whole cycle will be
offset to the right a few months, or whether it will just result
in a shorter overall lifespan for this event. That is yet
to be known.
Always
of interest is the relative activity
level of the Atlantic hurricane season. This past few years activity
was record breaking.
But contrary to the forecast produced for 2006 by Dr. William
Gray and the team at the University of Colorado, 2006 turned
out to be a complete dud. The forecast was for
an active season in August, with 15 storms and 7 hurricanes,
3 of which are to be intense, then revised downward to 11, 6
and 2 in Oct with 9,5 and 2 actually occurring. The team gave
much credit to the downward hurricane activity to the fast onset
of El Nino. In fact, they indicated the onset of this El Nino
was perhaps the fastest ever recorded. To paraphrase:
"The warming of the eastern and central Pacific during August through October
2006 has been truly remarkable. Only (the record breaking event of) 1997 witnessed
a larger temperature increase in Nino 3 anomalies from June-July
to August-September than did the 2006 season. But, in 1997, June-July
Nino 3 anomalies (2.1ºC) were already well above
average while 2006 June-July anomalies (0.1ºC) were not. This was by far
the largest percentage warming of SST anomalies between June-July and August-September
in the tropical Pacific for a year that had El Niño conditions in August-September."
In short, the rapid onset of El Nino and the ENSO models inability to forecast
it's coming caused the forecast to be skewed to the high side. El Nino produces
strong shearing winds over the Atlantic that tear the tops off developing
tropical storms rendering them weak and ineffective, which was clearly the case
this year. But this causes us some concern (see below).
The
latest El Nino discussion from the Climate Prediction Center/NCEP
(November 9, 2006) states that El Nino conditions to continue
into the spring of 2007. This seems reasonable given
the current state of the environment.
Of
18 ENSO models run in Nov 2006, all indicated warm conditions
through year end. Compare that with 12 models run in Sept where
10 indicated neutral conditions by year end and 2 suggested mild
El Nino. Clearly there is some work that needs to be done with
the long range ENSO models.
LONG-RANGE NORTH PACIFIC STORM AND SWELL GENERATION POTENTIAL FORECAST
Winter/Spring
2006-2007 Swell Generation Potential (for California & Hawaii)
= 7.0
There
is no data supporting a degradation into a La Nina event over
the next 6 months and lot's of data supporting the continued development
of El Nino. From a swell generating perspective this is good news.
The issue is that the atmosphere above the Pacific Ocean as of
now has shown absolutely no reaction to the development of El Nino, even with the occurrence of 2 solid active Phases of the MJO .
Dr Grays team is attributing the bust of a hurricane season in
the Atlantic to the evolution of El Nino. If this were
true, one would think the usual Pacific Basin atmospheric enhancements
normally attributable to El Nino would also be in evidence. But
instead net Pacific storm activity has been well below normal with not
one significant class storm occurring so far this season. We suspect
that El Nino might have had the impact on the Atlantic
summer tropical climate as indicated by Dr Gray and team, mainly because the tropical Atlantic is the first stop in the eastbound global equatorial conveyor belt, but those anomalies have not been established long enough to circumnavigate the entirety of the globe to start feeding the Indian Ocean area moving eastward into the Pacific. That said, our current working theory is that it take 6 months from the time the first solid El Nino indices become established in the Pacific before the usual upper anomalies manifest themselves and start influencing Western Pacific upper level weather.
El
Nino typically enhances the size, strength and frequency of winter
North Pacific storms in and around the Gulf of Alaska, thereby
improving the likelihood for large winter surf in California and
Hawaii. And our theory is mainly attributable to the late start
of El Nino. Our current thinking is that due to the late start
of El Nino the atmosphere is still reconfiguring itself and has
yet to get all the pieces in.cgiace to support winter storm development
in earnest. Net tropical activity in the Pacific was a little better
this year, but nothing more than average. And the fall storm season
has been a total bust. But there's no denying El Nino is in.cgiay,
and it will have it's impact on the atmosphere in time. We suspect
the season will begin late and last longer than normal, with significant
storms likely occurring well into the Spring. We'll be watching
for the next active phase of the MJO to see whether it has a positive
impact on surface level storm development. The big active phases
of the MJO in August and October produced nothing of interest,
with a major .cgiit jetstream flow in control of the entire North
Pacific. But that appears to be waning and a good indicator will
be to monitor what impact the next developing active phase of the
MJO has on net storm activity in the North Pacific.
As
such we've actually increased the Storm/Swell Potential
Rating from 6 to 7 for the Winter/Spring season, betting on El
Nino's influence having a moderate but late coming impact.
(This forecast is highly speculative and based on historical analysis of past La Nina/El Nino events and the latest long-range forecast models)
Sea Surface Temperature Anomalies
Courtesy: NOAA NESDIS
Notice a broad area of warmer than normal water (orange/red) extending over the equator from the dateline east into South America typical of moderate El Nino conditions. This is created by surface winds blowing west to east over the equator, a reversal of the normal trade wind flow there (east to west).
.
Sea Surface Temperature Anomalies and Average Surface Winds on the Equatorial Pacific
Courtesy: NOAA PMEL
In the top image notice winds blowing from east to west over the entire Tropical Pacific Ocean, the standard trade wind pattern for this time of year. Data during October indicated a semi permanent area of winds blowing west to east (reverse of normal) when the MJO was in it's active phase. . Notice the results of that MJO pulse in the lower image where significantly anomalous warmer waters are tracking from the West Pacific towards South America caused by these same winds in October that were blowing to the east over the West Pacific. As a result water temperatures are 1.5-2.0 degrees C above normal.
.
Sea Surface Height Deviation
Courtesy: NLOM
This is an old image before the MJO pulse of October got established. Notice that sea surface heights are slightly above normal right over the equator pushing into South America but not overly so. If we had a more recent image (none available due to the outage of the Jason-1 satellite) it is likely seas surface heights would be far higher. Warmer waters raise the oceans surface slightly.
.
20 Degree Thermocline Depth and Position Time Series
Courtesy: CPC NCEP NOAA
(Top Image) The core of warm subsurface water is centered slightly east of normal in the West Pacific and are pushing east further than normal, decreasing the angle between the West and East. This is consistent with a mild to moderate El Nino.
(Lower Image) Notice the very pronounced pocket of anomalously warm water (5 deg C above normal) pushing east from 120W. This is a strong Kelvin Wave produced from the Westerly Wind Burst and active phase of the MJO in October.
.
Equatorial Pacific Sea Surface Temperature Forecast
Courtesy: NOAA/NCEP
Notice that the average of many separate runs of the NCEP model suggest a continuation of warmer waters in the tropical East Pacific well into Spring of 2007.
.
Southern Oscillation Index (SOI)
Courtesy: BOM
The SOI depicts the difference in pressure between Tahiti and Darwin Australia. When it is consistently negative (that is surface pressure is lower in Tahiti than Darwin Aust), the trend is then towards El Nino. And when it is positive the trend is towards La Nina. Notice that since June it has been in the negative range with small cycles within that timespan up to current with the dips being the active phase of the MJO. The current inactive phase of the MJO is evidenced by the rising pressure regime at the very tail end of the image (but that is likely the head back down in about 3 weeks with a new pulse of the MJO expected),
|