Neutral Conditions - Lingering La Nina
But Warmer Water Over Tropical East Pacific
Early 2007 saw a marginal El Nino in-control of the tropical
Pacific, occasionally energized by bursts of energy from the Active Phase of the Madden
Julian Oscillation (MJO). But it never got any legs and had no net positive impact on swell production for the Spring of that year other than extending the winter surf season into May of 2007.
It was quickly followed by a moderate to strong La Nina event starting in the fall of 2007 continuing on into the winter and spring of 2008. The impact was an increase in storm activity over the Eastern Pacific, resulting in an increase in the number of swell events mainly along the US West Coast. To date that pattern has not completely subsided, even though El Nino tried to get a foothold during the summer. As of October the overall pattern was more La Nina influenced than El Nino. But in either case it makes little difference on the overall potential for large surf for the winter of 2008/2009. The paragraphs below describe the state
of various indicators used to assess long-term global weather conditions (be it either
El Nino or La Nina), followed by a revised set of criteria for assessing it's impact
on surf generation potential for the future.
First
we look at the Southern Oscillation Index (SOI). This number
compares surface pressure over Darwin Australia with pressure
over Tahiti. If this value is negative that indicates
average surface pressure is lower over Tahiti and higher over
Darwin, symptomatic of El Nino. Positive values indicate La Nina. The greater the negative or positive value, the stronger the ENSO (El Nino Southern Oscillation) configuration (be it El Nino or La Nina). During El Nino
episodes wind flows from generally high pressure over Darwin towards generally lower pressure
over Tahiti, which is a reverse of what a normal state is.
When it's positive, the reverse it true with higher pressure
over Tahiti and lower pressure over Darwin, typical of La Nina.
And wind flows east to west, typical of trades for this region,
only more so. The first 3 months of 2008 recorded nearly consistent
strong daily SOI values in the positive range, with nary a negative reading, typical of a moderate to strong La Nina. La Nina typically follows El Nino years, which was what the 2006/2007 winter was.
In May the pattern started moderating and by June solid changes started appearing in the SOI, with a string of negative reading starting to be recorded, consistent with the active phase of the MJO. Another active MJO event occurred in late July to early August too, helping to significantly erase the effects of the previous years La Nina with the SOI returning to a new '0' value. But since then the MJO, though still present, has ceased to produce a significant active phase to make any headway into negative/El Nino territory, and if anything the North Pacific has given up some of the progress it made towards El Nino. This is not unusual, with La Nina event sometimes lasting several years in duration. As of today, MJO activity continues to be weak with SOI values consistently heading back into positive territory through September into early October toggling in the +17 range, symptomatic of a weak La Nina state. Some of that positive state has given way just in early October, but that is all attributable to a short lived pulse of the active phase of the MJO, with an expected return to greater positive values expected in the next few weeks.
Looking
at current seasonally adjusted equatorial Pacific Sea Surface
Temperatures (SST), the pattern looks like a mix of both El Nino and La Nina. A clearly defined tongue of warmer than normal water extends
along the equatorial Pacific starting at Ecuador pushing
west to a point south of Hawaii. This is the polar opposite of what was occurring a year before, with cooler than normal water over this exact same stretch of real-estate. Today's warmer waters migrated from the West Pacific during the summers two active phases of the MJO, and had us thinking back then that perhaps El Nino was trying to develop. But that quickly came to a halt in August as the MJO fell apart, and no warmer water has migrated east since that time. Also a clearly defined horseshoe pattern attributable to La
Nina is set up over the Western Pacific, with cooler than normal
waters present in a line from Northern CA southwest to the intersection of the dateline and the equator, then southeast from that spot to Southern Chile. So we're in a hybrid state, part El Nino and part La Nina. During
El Nino events, warm waters from the far West Pacific start migrating
east along the equator in response to a shift in the SOI and
are blown there by a reversal of trade winds (more to follow).
Otherwise the South Pacific is exhibiting warmer than normal water temperatures
near and around Australia while up north warmer waters are in.cgiay from Japan northeast up to the Gulf of Alaska, mirror images of each other.
Warmer than average water is also evidenced
along the US Atlantic coast down into the the Caribbean and
Gulf of Mexico extending east to Africa. In all the La Nina signature is
evident, though not strong.
Wind
anomaly analysis indicates that on average winds have been blowing
stronger than normal off Ecuador pushing to about the mid-equatorial
Pacific, from east to west, typical of La Nina. These offshore
winds (relative to Ecuador) normally would cause upwhelling along the
coast of South America and produce cooler than average waters discussed above.
But the 2 strong active event of the active phase of the MJO over the past summer caused trades to reverse themselves, pushing a substantial amount of warmer then usual water to the east depositing it off the Central America coast. During these MJO events Westerly Wind Bursts (WWB) occurred,
which also helped to fuel tropical in the West Pacific. Of note: The MJO still has active
phases even during a La Nina year, just not as prolonged or strong.
A Westerly Wind Burst (WWB) is an extended duration of winds
that blow from west to east along the equator in the West
and Central Pacific contrary to normal trade winds, forcing warm
surface waters to start moving in the same direction of the
wind (details below), a hallmark of a strongly active phase of
the MJO and a precursor to El Nino. But the MJO events of the summer did not continue into the Fall, resulting in no transition to El Nino. Historically
if either El Nino or a strong burst of the Madden-Julian Oscillation
is in effect, trade winds that normally blow from east to west
reverse themselves and blow west to east. That is, when the MJO
is in an active phase, the trades reverse themselves in the West
Pacific, and when the MJO is not active, trades return. During
La Nina, trades blow much stronger than normal.
Another
key indicator in the evolution of either an El Nino or La Nina
event is the depth and profile of the 20 degree isotherm (thermocline).
During La Nina events, warm subsurface water remains pooled
up in the far equatorial West Pacific while cold surface and
subsurface waters dominate the East Pacific, resulting in a steep
angle from east to west, going from a shallow pool of warm waters in the
east to a deeper pool of warm water in the west. In El Nino events,
warm subsurface water (i.e. Kelvin waves - more below) migrate
from the west to the east Pacific and the angle flattens and the depth
of warm waters becomes more uniform across the entire equatorial Pacific.
Latest data indicates a solid pocket of cooler than normal water
(-3 deg C) lodged in the mid-Pacific south of Hawaii down about 150 meters, sitting stationary. What is really interesting is that over the summer, when the WWBs were occurring, a continuous flow of warmer than normal subsurface water was tracking from the west to the east, with a clear open subsurface current transporting these waters east. But with the advent of weaker active MJO cycles, and stronger inactive cycles, cooler water started developing in this area and basically shut-off the subsurface transport channel to the east. The warm water that successfully made the multi-thousand mile journey east became stranded off Ecuador, and reinforcements could not arrive, halting whatever transition towards El Nino was destin to occur. As a result the warmer water current there is starting to decay/cool, especially as trades begin to cycle back over that area causing upwhelling. So you end up with this hybrid configuration we find ourselves in, partly El Nino and partly La Nina. This is consistent
with what one could call a neutral configuration, though it seems tilted more towards the La Nina side of the equation.
A
Kelvin Wave is a pocket of warm water that travels under the
oceans surface from west to east at a depth of about 150-200
meters. It is generated by a burst of strong westerly winds blowing
over the equator (a.k.a. Westerly Wind Burst (WWB) in the West
Pacific associated with the MJO. As the warm surface water gains
eastward momentum, it sinks near the dateline and travels well
under the oceans surface, only to reappear at the surface when
it impacts the South America Coast. This results in the sudden
appearance of warm waters along the coast of Peru and Ecuador.
Occasional eruptions are normal. Large and consistent eruptions
are the hallmark of solid El Nino events. The source of Kelvin
Waves, a negative SOI and reversed trades, is directly related
to the strength and frequency of the active phase of the Madden Julian Oscillation
(MJO). This weather pattern is responsible for the periodic strengthening
of the anomalous westerly winds in the West Pacific which drive
production of subsurface Kelvin waves, and also drive the SOI
negative. When the MJO enters an active phase,
and does so frequently, El Nino indicators strengthen. As consistent
active phases of the MJO fade, so does El Nino.
Currently there is no evidence of any Kelvin Wave activity occurring
and none has occurred since at least early August, when the last of this years 2 WWB events occurred in sync with very active phases of the MJO. The resulting warm waters pushing
east from these WWB events made a significant dent in cooler
than normal waters that were firmly entrenched in the Eastern Tropical
Pacific earlier this year, the result of last years brisk La Nina. These cooler waters have since all been r.cgiaced with warmer water, but the spigot has since been turned off with no additional warm waters in-transit or able to make the journey due to a blocking pocket of cool subsurface waters south of Hawaii.
When
El Nino events unfold at the oceans surface, precipitation
will develop in the atmosphere above the warmer surface waters,
since warmer water supports higher condensation rates above it.
The presence of consistent precipitation where it historically
shouldn't be is a hallmark of El Nino. Current satellite data
indicates a slight increases in precipitation over the eastern equatorial
Pacific associated with the warmer than normal waters.cgiaced there by this summers MJO events. But the signature is weak and not expected to have much staying power. Drier than normal weather is suggested over the West Pacific, specifically Australia northward to the equator. The MJO travels against the
grain of the equator from west to east developing initially in
the Indian Ocean. It seems that the MJO has not been strong enough
to do much to transport moisture eastward. This is consistent
with weak a La Nina.
Reviewing
all the data over the past several months, it appears that an El Nino-like event tried to get started over the summer thanks to several strong active MJO pulses, but then the MJO lost it's energy and failed to continue transporting winds and warmer than normal water eastward, dooming any chance for and El Nino to evolve. Historically that is not unusual, especially directly following a pretty strong La Nina winter. But the events of this summer did provide substantial resources to help wipe out the symptoms of last years La Nina. All the cold water is gone from the equatorial East Pacific thanks to several WWBs and resulting Kelvin Waves, being r.cgiaced with warmer than normal water. But the
SOI has since rebounded from near-negative values over the summer, and has returned to a weak positive state more symptomatic of La Nina but in all probably represents the transition from La Nina to a neutral state.
Always
of interest is the relative activity
level of the Atlantic hurricane season. Hurricane activity in the Atlantic is inversely
tied to the strength and duration of El Nino and La Nina in the
Pacific. El Nino produces
strong shearing winds over the Atlantic that tear the tops off developing
tropical storms rendering them weak and ineffective at evacuating warm moist
surface air up high into the atmosphere through the storms eye.
In effect, a hurricane is the atmosphere's attempt to create
equilibrium, or to restore balance to a system that is too warm,
by creating a chimney to vent off the hot air. So if an an inordinate number of hurricanes occur
in the Atlantic, or if they are unusually strong, one could conclude
that the shearing effects of El Nino are not in.cgiay, which suggests
at least a moderate La Nina might be in effect. Looking at the Atlantic hurricane activity to date, one can conclude this season has been moderately active.
Dr Grey and associates at the University of Colorado forecasted
12 tropical storms and 6 hurricanes, 3 of which would be intense
this season resulting in a total of 124% the normal tropical
activity. Actual activity was at 153%, higher than even the above normal activity forecast. A normal year produces 9.6 named storms and 5.9 hurricanes.
The
latest El Nino discussion from the Climate Prediction Center/NCEP
(September 11, 2008) states that although ENSO-neutral conditions have been in.cgiace since June 2008, the atmospheric circulation over the western and central tropical Pacific continues to reflect lingering aspects of La Niña. Enhanced low-level easterly winds and upper-level westerly winds persist in this region, while convection remains generally suppressed over the central Pacific. Despite this lingering La Niña signal in the atmosphere, the overall atmospheric and oceanic system is consistent with ENSO-neutral conditions.
Looking at
the MJO models, the active phase of the MJO is just past it's prime (weak at that) and expected to move towards a weak inactive state. With a 30-45 day
cycle, it is not really knows how strong or weak this inactive phase will become,
but it seems reasonable that is will have no real effect on the anticipated outcome of neutral to mild La Nina conditions for the winter of 2008/2009.
Of
18 ENSO models run in September 2008, all indicated neutral
conditions through year end and beyond.
LONG-RANGE NORTH PACIFIC STORM AND SWELL GENERATION POTENTIAL FORECAST
Fall/Winter
2008-2009 Swell Generation Potential (for California & Hawaii)
= 3.5
Rating
based on a 1-10 scale: 1 being the lowest, 5 being normal/average,
and 10 being extraordinary
Updated Methodology (2008) : We have upgraded our methodology for making long term predictions. In the past we looked solely upon the presence El Nino using the approach that El
Nino typically enhances the size, strength, frequency and duration
of winter North Pacific storms in and around the Gulf of Alaska,
thereby improving the likelihood for large winter surf in California
and Hawaii. And that La Nina typically decrease the size strength,
frequency and duration of such systems.
But after reviewing data from many such years, we are turning more to the opinion that either strong El Nino or strong La Nina events have enhancing effects on net North Pacific storm formation. That is, the more extreme the divergence away from a neutral state, the greater the propensity for weather systems to try and return the system to a state of equilibrium in the form of storms (which create winds and therefore waves). In the El Nino state, the focus of the storm is centered more upon the dateline and the Western Gulf of Alaska, where in a La Nina scenario the focus is more on the Eastern Gulf. Therefore, the swell source moves east, making Hawaii a less likely target.
Also the relative strength of the MJO has an impact on the transport of tropical moisture from equatorial regions of the West Pacific northward to ultimately fall under the influence of the jestream, increasing the probability for storm formation moving over the dateline and into the Gulf of Alaska.
In addition we are become more convinced there is a teleconnection between activity in the southern hemisphere and that in the north 6 months later. That is, in years where the net storm activity is up in the southern hemisphere winter (summer in the N Hemi), a corresponding increase in activity could also be noticed in winter in the northern hemisphere (6 months later). The only exception is when there is a strong El Nino or La Nina up north in the winter, then that translates into a net increase in winter activity in the southern hemi 6 months later. Most of this focuses on the strength of the MJO, and seeing how the area it directly impacts is the equatorial Pacific which straddles both the north and south hemisphere's, it would seem reasonable to have an impacts at both poles. And yet one more possible early indicator is the configuration of the jetstream over the North Pacific starting late July into August over the North Pacific. There is some weak evidence to suggest a health consolidated flow over the NPac early in the season might lead to a continuation of that pattern through the Fall and Winter seasons, and that and early season .cgiit pattern continues in that mode. A .cgiit Northern hemi jestream does nothing to support surface level gale development.
Forecast Conclusion: There is no data to support a thesis that either a strong El Nino
or La Nina will develop over the next 6 months, and all data supports the continuation of ENSO neutral conditions or at best, redevelopment of weak La Nina conditions.
From a swell generating perspective this is not good. Last years (2007/2008) moderate.cgius La Nina activity produced a string of consistent and moderately strong swells along the West Coast, resulting in a net positive increase in surf for the season. But with ENSO moving neutral, odds of a repeat are slim.
MJO activity since August 2008 has significantly diminished, both in the active and inactive states. This will likely have a limiting effect on the transport of moisture to northern latitudes limiting fuel for storm development.
Furthermore the southern hemisphere winter storm activity (2008) was well below normal with only 1-2 significant class storms recorded. A good run of mid-sized storms did occur through early July, but we believe that was more a teleconnection between the strong La Nina in the Northern Hemisphere the winter before. And as the neutral ENSO conditions took hold over the equator by mid-late July, the storm track died in the south and never returned. Using this as another early indicator, it does not bode well for the Northern hemi winter of 2008/2009.
The one glimmer of hope is related to the jetstream pattern over the North Pacific during August and September. A solid consolidated flow has been evidenced there and continues into early October, with little .cgiit activity noticed. This could help to support gale development, assuming sufficient tropical moisture is pumped up from off Japan to northern latitudes. But that does not look promising. And the likely source for the rather good looking jetstream flow of current might be the increased activity of the MJO mid-summer. With that pattern in steep decline, it would not be surprising to see the jet fall apart in mid-to late Fall, and the storm track with it.
On
top of that, there remains the nagging question of whether we have moved well
into the Inactive Phase of the Pacific Decadal Oscillation (PDO). the PDO is in-effect is a 20-30 year cycle of weather than slightly
mirrors El Nino in the active phase and La Nina symptoms in it's
inactive phase. Our thinking is that if we are in-fact in the inactive
phase of the PDO (probably since 2000, and will be for the
next 20 years), then the odds for favorable winter storm generation conditions
are stacked more in favor of La Nina than El Nina, since the inactive phase of the PDO mimics a weak La Nina. But this is mostly just pure speculation on our part.
So assuming a neutral ENSO to maybe weak La Nina, with
a weak MJO and and inactive preceding Southern hemi season with the added effects of the inactive phase of the PDO, we calculate net storm activity
will be less than normal and when it does occur, the storms will
be shorter in duration and and less intense than normal.
(This forecast is highly speculative and based on historical analysis of past La Nina/El Nino events and the latest long-range forecast models)
Sea Surface Temperature Anomalies
Courtesy: NOAA NESDIS
Notice a broad and diffuse area of warmer than normal water temperatures (yellow and orange) extending along the equator from Ecuador to a point almost south
of Hawaii. This is the fading remnants of what was the start of an El Nino episode that started in May and built through August. It was caused
by strong westerly winds blowing (west to east) over the Pacific equator pushing warmer water from the west to the east. The winds were caused by enhanced activity of the active phase of the MJO. Also note warmer than normal waters pooled up in the West Equatorial Pacific extending from New Guinea northeast
to the Gulf of Alaska and southeast to Tahiti. This is the 'horseshoe pattern' symptomatic of La
Nina, and caused by the enhanced trades blowing from east to west over the equator of late.
.
Sea Surface Temperature Anomalies and Average Surface Winds on the Equatorial Pacific
Courtesy: NOAA PMEL
In the top image notice winds blowing from east to west over the entire Tropical
Pacific Ocean, the standard trade wind pattern for this time of year (if not
slightly enhanced). There is no evidence of reversed trades which would be associated
with either the active phase of the MJO or El Nino. Notice in the lower pane
that surface temps are lower than normal over the equator south of Hawaii and slightly
warmer than normal in the far west and east. The arrows indicate the strength and direction
of wind anomalies, which aren't too far off of normal in any region. In all there appears to
be a neutral pattern in.cgiay.
 |
20 Degree Thermocline Depth and Position Time Series
Courtesy: CPC NCEP NOAA
(Top Image) The core of warm subsurface water is centered in the far West Pacific
and is not making any headway to the east, which would be symptomatic of El Nino.
The very shallow depth of warm waters in the east are more an indicator or La
Nina, but only faintly.
(Lower Image) Notice the pronounced pocket of cooler water (nearly 3
deg C below normal) at 140W and 150 meters deep. This is
a rather recent development over the past mont and a half indicative of the trades starting to blow from the east at the oceans surface,
forcing cooler water deeper almost in a reverse Kelvin Wave.
This pattern is much different from earlier in the summer when warmer than normal waters extended from the far west into the east. generating the pool of warm water presently fading in the east off Ecuador.
.
Equatorial Pacific Sea Surface Temperature Forecast
Courtesy: NOAA/NCEP
Notice that the average of many separate runs of the NCEP model suggest generally no change in water temperatures through Spring on 2009 consistent with neutral ENSO conditions.
.
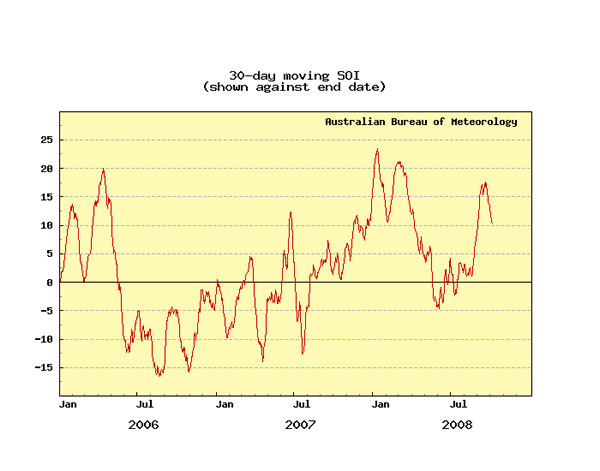
Southern Oscillation Index (SOI)
Courtesy: BOM
The SOI depicts the difference in pressure between Tahiti and Darwin Australia.
When it is consistently negative (that is surface pressure is lower in Tahiti
than Darwin Aust), the trend is towards El Nino. And when it is positive
the trend is towards La Nina. Notice that since July of 2007 there was
a steady upward trend, symptomatic of La Nina which peaked last winter. A strong drop down into the summer of 2008 suggest a near El Nino was trying to form, but then it rapidly gave up ground in September and has stabilized near +15. there. Also notice that even within this broad trend there are distinct
smaller up and down cycles at 30-45 days each. These are pulses of the MJO. Dips are the active phase
of the MJO and rises are the inactive phase. The current active phase of the
MJO is evidenced by the falling pressure regime at the very tail end of the image.
|