Weak-Moderate El Nino Developing
Solid Warm Pattern in-Play Over the Equatorial East Pacific
Overview: Early
2008 saw a marginal El Nino try to take control of the tropical
Pacific from March into July, fueled by several active phases
of Madden Julian Oscillation (MJO). The MJO faltered and La
Nina returned, cutting the legs off the developing warm pattern. But
the MJO was strong enough for long enough to cause anomalously
warm warm to appear off Central America and change
the atmosphere creating momentum that fueled the development
of a decent Fall storm pattern, holding on into late
November 2008. But right when things were starting to get in
a groove, the upper level (jetstream) winds that were driving the
machine and fueled by the warm waters off Central America during
the summer months, disintegrated. A .cgiit jetstream flow took
over totally shutting down the storm pattern. The remainder
of the Winter and Spring 2008/2009 season were completely.cgiacid. With that in mind, we moved into the Spring of 2009 seeing a similar
pattern. That is, the MJO came-on strong again with a solid series
of consecutive Active Phases and a marked increase in westerly wind
anomalies in the West Pacific resulting in anomalously warm
subsurface waters tracking east towards Central America (Kelvin Waves).
As the Kelvin Waves erupted along the Central American coast, warm
surface waters began to appear, much like the year previous, but with
more vigor. It is with that background scenario that we
look to the coming Fall and Winter of 2009/2010 with higher
expectations and the hope for real surf for the first time in over
a decade for Hawaii, Canada and the US West Coast. The
paragraphs below describe the state of various indicators used to
assess long-term global weather conditions (be it either El Nino or La
Nina), followed by a revised set of criteria for assessing it's impact
on surf generation potential for the future.
SOI: First
we look at the Southern Oscillation Index (SOI). This number compares
surface pressure over Darwin Australia with pressure over Tahiti. If
this value is negative for an extended period of time, that indicates
average surface pressure is lower over Tahiti and higher over Darwin,
symptomatic of El Nino (or over short durations, ~ 20 days, the Active
Phase of the MJO). Positive values over longer times indicates La Nina
(or the Inactive Phase of the MJO for shorter durations). The greater
the negative or positive value, the stronger the ENSO (El Nino Southern
Oscillation) configuration (be it El Nino or La Nina). During El Nino
episodes wind flows from generally high pressure over Darwin towards
generally lower pressure over Tahiti, which is a reverse of what a
normal state is. When it's positive, the reverse it true, with higher
pressure over Tahiti and lower pressure over Darwin, typical of La
Nina, with wind flowing east to west, typical of the trade wind pattern for this
region, only more so. The first 3.5 months of 2009 recorded nearly
consistent strong daily SOI values in the positive range, with hardly
any negative readings, typical of a moderate La Nina. In
fact, the Winter of 2008/2009 and early Spring of 2009 were
dominated by a La Nina pattern. But by mid-April the pattern
abruptly changed with negative SOI readings appearing and holding
consistently through late June, consistent with the active phase of the
MJO. And closer inspection revealed that a series of 3 consecutive
and separate Active Phases of the MJO occurred, with no Inactive Phase in-between.
Most unusual. A weak Inactive Phase developed in late June
holding into mid-July, followed by another Active Phase (negative
readings in the SOI) from mid-July into early August. The net result is
that all the effects of the previous years La Nina were erased
with the 90 day average SOI not only returning to a neutral value
of '0' but dipping consistently into the negative range (-2.0 or
so). Other indicators suggest that El Nino is clearly in-effect, but
the failure of the SOI to dip firmly into negative territory (-10 or
greater) with any significant magnitude remains pe.cgiexing. NOAA
suggests that during moderate to strong El Nino and La Nina events the
MJO signal weakens with pulses one way or the other lessening in
intensity. That would e.cgiain the general trend of late of weaker
MJO activity with less effect on the SOI, but the overall value of the
SOI still being near neutral is puzzling. As of today, a
very weak inactive Phase of the MJO was trying to get a foothold and
modeled to last for 2-3 weeks.
Anomalous Sea Surface Temperature: Looking
at current seasonally adjusted equatorial Pacific Sea Surface
Temperatures (SST), the pattern clearly delineates El Nino. A well
defined pool of warmer than normal water extends over the width of
the equatorial Pacific starting above New Caledonia continuing
east over the dateline about 0.5 deg C above normal then building
while pushing to Ecuador with maximum temperatures up to 3 deg C
above normal there. This is the classic signal of El Nino and is
the exact opposite of what was occurring even in the early Spring of
this year when cooler than normal water was over this exact same
stretch of real-estate. Today's warmer waters migrated from the West
Pacific during the three consecutive active phases of the MJO in the
Spring and early Summer, with a steady flow of milder warm water
moving east after
those events. Also warmer than usual water was migrating north up the
North American coasts of Mexico, Baja and into Southern CA, the result
of suppressed trades in the area allowing the tropical warm waters of El
Nino to head poleward. Also a pool of much warmer than normal
water was pushing northeast off Japan and quite pronounced in the Gulf
of Alaska. Of interest is a clearly defined flow of cooler than
normal water pulsing off equatorial Africa in the equatorial Atlantic,
the exact opposite of what is occurring in the Pacific. Looking back in
the historical record a similar pattern occurred during the record
breaking El Nino of 1997/98. And during lesser El Nino years a
similar but weaker pattern is evidenced, but not during La Nina
years. This could possibly be the result of the Walker
Circulation forming over the Pacific warm pool near Ecuador,
drawing in surface air from Africa across the Atlantic causing
upwelling. This flow of cooler than normal water ought to hinder
tropical development in the Cape Verde Storm Corridor. A reverse
teleconnection between the Pacific and the Atlantic is known to exist. That is, when the Pacific Ocean is active the Atlantic is
inactive from a storm perspective, and visa versa. It will be
interesting to see how this.cgiays out late this summer, now that we're
approaching the core of the Atlantic tropical season. Expect the
Atlantic storm season will be much less active than normal. The South
Pacific remains near neutral if not slightly on the cool side. Overall
the signs of El Nino are quite evident, with the classic warm pool
in.cgiace off Central America.
Wind Anomalies: Wind
anomaly analysis indicates that on average trades over the
equatorial Pacific have been blowing
weaker than normal, especially in the far Western Pacific to the
dateline. In fact, there have been several instances of a total
reversal of the trades there. Rather than blowing east to west
they have been blowing west to east, and at other times they have been
blowing less strong than normal, which has the same effect as a
reversal of trades in that it supports the generation of a Kelvin Wave
(more about that below). With trades being suppressed, this reduces
the amount of upwelling along the coast
of South America, allowing the collection of warmer water there.
Stronger than average winds there increases upwelling producing
cooler than average waters. The 4 solid Active Phases of the MJO
that have occurred so far this Spring and Summer caused
trades to reverse themselves, each pushing a
substantial amount of warmer then usual water to the east and
depositing it
off the Central America coast. These instances of reversed
trades/westerly winds are called Westerly Wind
Bursts (WWB). These have been i.cgiicated in not only
transporting
warm water east, but also help to fuel tropical development the
the Central and West
Pacific. Of note: The MJO still has Inactive Phases even
during El Nino
years, just not as prolonged or strong. A Westerly Wind Burst (WWB) is
an extended duration of wind that blows from west to east along the
equator in the West and or Central Pacific contrary to normal trade
winds,
forcing warm surface waters to start moving in the same direction as
the wind (details below), a hallmark of a strong Active Phase of the
MJO and a precursor to El Nino. The MJO events of the Spring moderated
some in intensity moving into the summer (as did
subsequent Inactive Phases), but did not fade as they did the year
before. In fact, the late July Active Phase produced a solid WWB
(7/25-8/2) resulting in yet another decent pocket of warm water feeding into
the eastward moving conveyor, bound for Central
America. Historically if either El Nino or a strong burst of the
Madden-Julian
Oscillation is in-effect, trade winds that normally blow from east to
west reverse themselves and blow west to east. That is, when the MJO is
in an Active Phase, the trades reverse themselves in the West Pacific,
and when the MJO is not active, trades return. During La Nina, trades
blow much stronger than normal.
Pacific Isotherm: Another
key indicator in the evolution of either an El Nino or La Nina
event is the depth and profile of the 20 degree isotherm (thermocline).
During La Nina events, warm subsurface
water remains pooled up in the far equatorial West Pacific while cold
surface and subsurface waters dominate the East Pacific, resulting in a
steep angle from east to west, or from a shallow pool of warm
waters
in the east to a deeper pool of warm water in the west. In El Nino
events, warm subsurface water (i.e. Kelvin waves - more below) migrate
from the West to East Pacific and the angle flattens and the depth
of warm waters becomes more uniform across the entire equatorial
Pacific. Latest data indicates a solid pocket of warmer than normal
water (+2 deg C) tracking from just east of the dateline down
about
125 meters, bound for Central America. And it is intensifying as it
progresses east. This is the fourth such Kelvin wave to occur this year
(at least) and was produced by a WWB that developed just west of the
dateline in late July. This was a positive development, coming
right on the heels of the mid-June Inactive Phase and what was thought
to be a lessening in the intensity of El Nino, possibly signaling a
fade like what occurred the year before. But that now looks not to
be the case. Though the MJO signal has remained weak, it appears
that the Active Phases are more productive than the Inactive ones,
tipping the scales in favor of El Nino. Warm water
that successfully makes the multi-thousand mile subsurface journey east
to Ecuador erupts to the surface just off the coast there, and
weaker than usual trades then blow the warm surface water off to the
east, also radiating north up the Mexican coast reaching into
California during significant El Nino events. This results in a pool
of warm water forming off Central America rather than it's usual.cgiace
in the West Pacific, flattening the angle of the 20 degree C
isotherm across the equatorial Pacific. At this point an El
Nino pattern is clearly in control with no sign of cooler than usual
waters off Central America and flatter than usual isotherm
angle.
Kelvin Waves: A Kelvin Wave is a pocket of warm water that travels under the oceans
surface from west to east at a depth of about 150-200 meters. It is
generated by a burst of strong westerly winds blowing over the equator
(a.k.a. Westerly Wind Burst (WWB) in the West Pacific and is typically
associated with
the Active Phase of the MJO. As the warm surface water gains eastward
momentum by forcing of the WWB, it sinks
near the dateline and travels well under the oceans surface, only to
reappear at the surface when it impacts the South America Coast. This
results in the sudden appearance of warm waters along the coast of Peru
and Ecuador. Occasional eruptions are normal. Large and consistent
eruptions are the hallmark of solid El Nino events. The source of
Kelvin Waves, a negative SOI and reversed trades, is directly related
to the strength and frequency of the Active Phase of the Madden Julian
Oscillation (MJO). This weather pattern is responsible for the periodic
strengthening of the anomalous westerly winds in the West Pacific which
drive production of subsurface Kelvin waves, and also drive the SOI
negative. The MJO runs in rough 40-60 day cycle, roughly 20-30 days of
the Active Phase followed by 20-30 days of the Inactive Phase.
The cycles alternate continuously year after year and are stronger
during the northern hemisphere Fall, Winter and Spring season and
lessen during the summer. When the strength of Active Phases of
MJO dominate, El Nino indicators strengthen. When the Inactive
Phase dominate, La Nina moves to the forefront. That is not to say that
the MJO causes either El Nino or La Nina, only that it appear to
support the development of either extreme of the ENSO cycle. In other
words, when the balance of energy favors the Active Phase, the odds of
El Nino developing increases. When the balance
shifts towards the Inactive Phase, La Nina becomes more
likely. Currently there is clear evidence that the most
recent Active Phase of the MJO (in late July) produced a Kelvin
Wave that is currently working it's way across the equatorial Pacific
with no cooler water pockets in it's way to block it's progress. Pacific Equatorial Counter Current: There
are three currents that run along the Pacific equator. Two run
just abreast (a few degrees north or south) of the equator flowing east
to west driven by the semi-permanent high pressure centers located
in the center of the North and South Pacific.
These high pressure system are what drives equatorial
trade winds too. But sandwiched between them is the Pacific
Equatorial Counter Current, which flows against the two, running
west to east. Satellite based sensors are used to measure the
strength/speed of the counter current. That data can be
analyzed to determine if the current is flowing stronger or weaker
than in years previous. In essence, anomalies in the
current can be detected. A curious fact becomes apparent when
looking at long-term trends: During El Nino years the counter
current runs harder than usual to the east, and during La Nina years it
runs harder to the west. This is what one would expect, especially
since the exact same pattern appears when
analyzing tradewinds. Looking
at data for this year it is apparent the current is running stronger
than normal towards the east, a signal of El Nino. Looking at this
years data compared to previous years (the record starts in '93) it is
in the range of the '94, '02 and '06 events in terms of the size of the
anomaly. But this years event bested all those but 2002 when you looks
at the time of the year it started (Jan) where the others started at
least 3-4 months into the year. In these previous events (including the
record year of '97) it was not really till the Fall
months that the current bloomed to it's
full potential. This
suggests that more strengthening is yet to occur. And interestingly
most had some sort of a pause or significant decline in the
flow in the July/August timeframe, before the final push into Fall
(except 2006). 2009 appears to be no exception, with that pause
occurring now. In many cases, the current changed before the SOI
dropped for the first time that year into it's first run of
sustained negative numbers (i.e. the first Active Phase of
the year): 2002 current change was Feb 1/Negative
SOI starting mid-March, 2006 current change mid-Feb/SOI early May,
09 current mid-Jan/SOI negative late April/though dropping since Feb. 1994
was excluded from the review because it appeared that a multi-year ENSO
event was occurring, carried over from '92/93. This
is all new data and the record is very short, so no solid conclusions
can be drawn, but it provides some foresight for future research.
Regardless, this El Nino sits in the
middle of the pack with other like-sized weak-to-moderate
events.
OLR: When
El Nino events unfold at the oceans surface, increased
cloudiness/precipitation will develop
in the atmosphere above the warmer surface waters, since warmer water
supports higher condensation rates above it. The presence of consistent
cloudiness or precipitation where it historically shouldn't be is a
hallmark of El
Nino. Satellite based Outgoing Longwave Radiation (OLR) measurements
track reflectivity from clouds over time. The greater the
reflectivity, the less sunlight is being absorbed by clouds, and so the
lower the amount of reflection off the oceans surface. Low reflectivity
values represent greater cloud absorption. Current satellite data
indicates a slight increases in
cloud cover over the eastern equatorial Pacific associated with
the
developing warm pool there. An area of persistent cloudiness over the
Western Pacific a few weeks before was likely associated with the
Active Phase of the MJO, and has since dissipated consistent with the
recent turn towards the Inactive Phase. Drier than normal
weather is suggested over the West Pacific,
specifically Australia northward to the equator. But again suspect that
is more associated with the MJO's current Inactive Phase. This is
marginally consistent with weak
a El Nino.
Analysis: Reviewing
all the data over the past several months, the evidence clearly
indicates some form of El
Nino event has developed and appears to be continuing to evolve.
It started in the Spring with consecutive Active MJO pulses generating
WWB's that in turn created Kelvin Waves transporting warmer than normal
water to the east. There was a short break in June followed by
another WWB in July and another Kelvin Wave that at this time is still
working it's way to the east. Warm water 1.0-1.5 degrees C above normal
is in.cgiace off Central America with no sign of dissipating anytime
soon. We now are entering another Inactive Phase, but would
hope to see another WWB in the next scheduled Active Phase in early to
mid September. Looking
at satellite based
historical ocean surface temperature anomaly measurements, waters
have not been this
warm at this time of the year since the
record setting El Nino of 1997/98. And even further back only the the
strong El Ninos of 1982 and 1987 exceeded the
magnitude of the current event in the months of August. In other
words,
this is the
strongest warm pool that's occurred in the last 12 years.
Make no mistake though, it is not on-par with the super events
of 1982, '87 or '97. But what is does have in common with them is
that it is a 'classic' El Nino as compared to a Modoki El Nino. A
Modoki El Nino (Modoki is Japanese for 'the same but different') forms
more in the center of the equatorial Pacific (south of Hawaii), in the
Nino 4 region, and evolves there, rarely making much eastward headway
through it's life and not typically reaching the Ecuador coast. These
El Nino events tend to be more weak-to-moderate in strength too,
with lesser impact on the northern hemisphere Fall, Winter and Spring
storm pattern. They still have an enhancing impact, just not as strong. The
Classic flavor of El Nino starts forming it's warm pool directly
adjacent to Ecuador and expands westward as it matures. The
environmental impact tend to be more severe. This current event
is of the classic variety, only one of 5 that have occurred since 1980
(82/83, 87/88, 91/92 [debatable], 97/98 and now 09). This current
event is the weakest of the bunch, but then all but the 91
event were exceedingly strong. In
all instances the classic form of El Nino evolves and builds from Aug
into Dec. This suggests more strengthening is historically not
only possible, but likely. Conversely, the Modoki flavor of El Nino
tends to start either weak or weak-to-medium in strength (relative
scaling based on July water temp anomalies) and have 50/50 odds of
strengthening into December. Recent Modoki ENSO events occurred
in 86, 90, 93, 94, 02, 04 and 06. That strengthening was generally
moderate, with none reaching the strong category by Dec. But in
all cases, they did not fade, just never developed
particularly stronger than what they were in July. Given
that historical background, this event appears to best any
but the strongest ENSO events over the past 27 years ('82, '86,
perhaps '91 and '97). That
is the good news.
The
more disconcerting news is the lack of a
clear response by the SOI. One would expect that if a solid
El Nino was developing the SOI would be negative, and not just a little
but more like in the -10 to -15 range rather than the current 90 day
average of ~ -1.5. Relatively this is much better than anything that has
occurred in the past 3 years, with the start-off spike for this
event well into negative values in late April and May most
impressive. But it
could not be sustained and even now struggles to
stay negative. OLR data is inconclusive too. All this leads
to what could be considered a muddled picture. But assuming the
historical trend presented above is accurate for classic El Ninos,
one would expect to see strengthening over the coming Fall months and a
deepening (into negative territory) of the SOI over time. That
remains to be seen.
Regardless
of the statistical indicators, the fact remains that there is a
moderate
and building pool of warm water off Central America that has been
in.cgiace since June and is showing no sign of dissipating. And since it
is the presence of anomalously warm water off Central
America that drives changes in the atmosphere, and
the classic form of El Nino has the most impact, then the
fact that this current event exists at all and is as warm as
it currently is
trumps all other indicators and analysis. In short, the argument is "It
exists so therefore it cannot be denied". The only remaining question
is: "How long
will it last and how strong will it become?"
Always
of interest is the relative activity level of the Atlantic hurricane
season. Hurricane activity in the Atlantic is inversely tied to the
strength and duration of El Nino and La Nina in the Pacific. A classic
El Nino
produces strong shearing winds over the Atlantic that tear the tops off
developing tropical storms rendering them weak and ineffective at
evacuating warm moist surface air up high into the atmosphere through
the storms eye. In effect, a hurricane is the atmosphere's attempt to
create equilibrium, or to restore balance to a system that is too warm,
by creating a chimney to vent off the hot air to the upper atmosphere.
So if an an inordinate
number of hurricanes occur in the Atlantic, or if they are unusually
strong, one could conclude that there is a build up of latent heat
energy in the ocean and the shearing effects of El Nino are not
in.cgiay, which suggests at least a moderate La Nina might be in effect.
Looking at the Atlantic hurricane activity to date, there had been
effectively no activity until 8/14. Quiet as a mouse. since then
three systems formed quickly, all dying fast other than Hurricane Bill.
Dr Grey and associates
at the
University of Colorado forecast 10 tropical storms and 4 hurricanes,
2 of which would be intense this season resulting in a total of 85%
the normal tropical activity (8/4 forecast). A normal year
produces 9.6
named storms and 5.9 hurricanes. At this point odds are likely
that even that estimate might be high. Conversely, if this were a
Modoki El Nino, the impact on tropical development in the Atlantic is
theorized to be much reduced, if not actually enhancing the odds for
development (we have our doubts about that, especially after reviewing
historical data on number of storm days during those years).
The presumed theory is that since the Modoki El Nino forms in the
Central Pacific, in-flow to the associated Walker circulation east of
the core of the warm pool which normally would be over the Tropical
Atlantic is shifted west, over South America. This results in in less
shearing if not actually
supporting a consistent east to west flow both at the surface and at
upper levels. But again we have our doubts. Also of note, the
presence of a classic El Nino in
the tropical Pacific supports the development of tropical storms both
in
the East Pacific (off Mexico) and during WWBs and the Active Phase of
the MJO, in the far West Pacific. That trend has been in
evidence, with a steady pack of stronger systems already on the
books in the West Pacific, but also a steady stream of lesser
storms in the East with no end in sight. This is a significant change
from the past three years, which have had below normal activity levels.
The
latest El Nino discussion from the Climate Prediction Center/NCEP
(August 6, 2009) states that a weak El Nino was present during July
2009 and expected to strengthen and last through the northern
hemisphere winter of 2009-2010. Models:
Looking at the MJO models, a rather vigorous pulse of the Inactive
Phase of the MJO was reaching over the dateline while a weak Active
Phase was exiting over Central America.The Inactive Phase is to become
dominant and peaking out by 8/18, then slowly fading through
8/28 and all but gone by 9/2 while a new Active Phase starts building
in the Indian Ocean. The projected strength of this Inactive Phase is
somewhat surprising (at least on the models) given that El Nino is
supposedly building, and will likely take a pretty good bite out of the
developing warm pool off Ecuador. One last solid Kelvin Wave is
en-route to Central America, likely to help provide
reinforcements, but then it will be a long haul till another follows,
unless some unforeseen event generates another. With 20-25 day cycles
between each phase change, it will be mid-Sept before another could
expected to be generated.
Even
further out, of 18 ENSO models run in July 16 2009, all but 3 indicated
some form of El Nino developing with waters temps greater the 0.5 deg C
above normal. the remaining 3 indicated a rise less than 0.5 degs. none
indicated La Nina. The average of the peak was 1.25 degrees above
normal occurring in mid Nov. with anomalies 1 deg or grater into April of
2010.
LONG-RANGE NORTH PACIFIC STORM AND SWELL GENERATION POTENTIAL FORECAST
Fall/Winter
2009-2010 Swell Generation Potential (for California & Hawaii)
= 7.5
Rating
based on a 1-10 scale: 1 being the lowest (small and infrequent winter
surf conditions), 5 being normal/average, and 10 being extraordinary
(frequent events of large long period swells)
Updated Methodology (from 2008) :
We have upgraded our methodology for making long term predictions. In
the past we looked solely upon the presence El Nino using the approach
that El Nino typically enhances the size, strength, frequency and
duration of winter North Pacific storms in and around the Gulf of
Alaska, thereby improving the likelihood for large winter surf in
California and Hawaii. And that La Nina typically decrease the size
strength, frequency and duration of such systems. But after reviewing
data from many such years, we are turning more to the opinion that
either strong El Nino or strong La Nina events have enhancing effects
on net North Pacific storm formation. That is, the more extreme the
divergence away from a neutral state, the greater the propensity for
weather systems to try and return the system to a state of equilibrium
in the form of storms (which create winds and therefore waves). In the
El Nino state, the focus of the storm is centered more upon the
dateline and the Western Gulf of Alaska, where in a La Nina scenario
the focus is more on the Eastern Gulf. Therefore, the swell source
moves east, making Hawaii a less likely target.
Also
the relative strength of the MJO has an impact on the transport of
tropical moisture from equatorial regions of the West Pacific northward
to ultimately fall under the influence of the jetstream, increasing the
probability for storm formation moving over the dateline and into the
Gulf of Alaska.
In
addition we are become more convinced there is a teleconnection between
activity in the southern hemisphere and that in the north 6 months
later. That is, in years where the net storm activity is up in the
southern hemisphere winter (summer in the N Hemi), a corresponding
increase in activity could also be noticed in winter in the northern
hemisphere (6 months later). The only exception is when there is a
strong El Nino or La Nina up north in the winter, then that translates
into a net increase in winter activity in the southern hemi 6 months
later. Most of this focuses on the strength of the MJO, and seeing how
the area it directly impacts is the equatorial Pacific which straddles
both the north and south hemisphere's, it would seem reasonable to have
an impacts at both poles. And
yet one more possible early indicator is the configuration of the
jetstream over the North Pacific starting late July into August over
the North Pacific. There is some evidence to suggests a healthy
consolidated flow over the NPac early in the Fall season might lead to a
continuation of that pattern through the Winter season, and
that if an early season .cgiit pattern develops, it will continue in that mode through Winter and Spring. A .cgiit
Northern hemi jetstream does nothing to support surface level gale
development.
Forecast Conclusion: There
is.cgienty of data to support a thesis that weak to
moderate El Nino conditions will persist over the next 6+
months. The presence of a warm pool positioned in the classic El
Nino corridor and a look at what happens historically when such a pattern
is preset at this time of year is all the evidence required. So the
issue then turns to a discussion on whether it will develop more,
or just hold. At this time it does not seem likely that it will
evaporate, though that is always an outside possibility. Historically
Classic El Ninos continue to develop through the Fall months, peaking
out in December with effects on the environment holding well through
Spring, and if strong enough, affecting Summer and Fall of the
following year (or longer). But that is only in the case in an extreme
event (i.e of magnitude similar to '82/83, '88/88 and the '97/98
events). There is no evidence whatsoever to suggest this years event
will come anywhere close. Rather a moderate event is the best
likely outcome, with reasonable odds it could actually hold and
become no stronger than it is today (weak to moderate).
The
biggest concern is the strength of the current Inactive Phase of the
MJO (8/14/2008) and it's possible detrimental effects on the developing
warm pool. There is always the possibility that this is the start of a
series of stronger pulses, with a possible solid Active Phase
developing in September to counteract whatever is lost in August.
But such a discussion would be pure speculation and is
unsupportable by any objective evidence. So we have to go with what is
real now. Over the short run the Inactive Phase will likely have a
limiting effect on
the transport of moisture to northern latitudes limiting fuel for storm
development, and putting a damper on what was starting to look like a
decent though not spectacular North Pacific tropical season. The good
news here is that El Nino appears to already be having some positive
impact in the North. And it will only serve to extend the tropical
season, likely into November or later if it evolves as expected.
Down
south, southern hemisphere net winter storm activity was
been above previous years, more reflective of a historically
'normal'
pattern, with 4 significant class storms/swells occurring and a
series of solid utility class storms resulting in swell having hit
Hawaii, though smaller along the US mainland. Reviewing rainfall
records for Eastern Australia over the past 6 months, the area most
often affected by El Nino during their winter months, a drought has
been
declared in Central Queensland covering 35% of the total land
area with rainfall reported at 10% or less of normal and the same
condition over a large swath of North-Central Australia. Anecdotal
reports indicate a hard drought and wildfires are persistent. So there
is sufficient evidence to support that El Nino is already affecting the
atmosphere on at least a large regional level (Pacific Basin). And that
affect is likely to expand, deepen and gain in momentum the longer
the warm pool stays in.cgiace, branching out and starting to turn events
in the Atlantic and Indian Ocean too. And we suspect that is
already occurring, as evidenced by the strong cool flow present off
tropical West Africa and the apparent damper on tropical storm activity
there.
The
North Pacific jetstream pattern looks good as of early August
supporting transport of a steady stream of small but cohesive low
pressure centers off Japan tracking over the dateline and
lifting north into the Bering Sea near the Western Gulf of Alaska.
This is what one would expect to see if El Nino was in.cgiace. And
this has been happening since late July. A pocket of cooler than normal
waters is positioned in the northern dateline region, evidence of the
mixing effect winds from these system have had in the region.The
next step in this process would be to see tropical systems in the
west
turned hard east, transitioning to extratropical status
and building while moving over
the dateline towards the Gulf. In the super El Nino of '97, the
first Significant class storm of the year occurred in mid-Sept, an
extratropical cyclone resulting in 65 kt winds over a large area aimed
east producing swell of 10 ft @ 25 sec solid hitting the
California coast on Sept 27. And lesser northwest swell producing
systems had occurred as early as mid-August. Clearly that is not
the expectation this year, but it provides some historical context and
a model of what can occur in the perfect scenario. We are in that
window now, so it is advised to keep a watchful eye to
the west. We
have assigned a swell potential rating of 7.0 for the coming Fall and
Winter season, suggesting that there is better than average odds of
historically longer runs of Significant Class Winter swells. That
means not only more storm frequency, but stronger and longer lasting
ones producing larger and longer lasting swells. A temporary return to
the glory days of the late 90's and early 2000's. Compared
to the absolutely abysmal surf pattern of the past 3 winter
seasons where we would get one day, or even 12 hour swell
events, this years pattern should stand in stark
contrast and be a much welcome change. Plan your surf strategy for the
long run, where endurance and stamina month after month outweght
short feasts and 'go-for-broke' assaults. Likewise
weather will likely.cgian a factor in CA. More moisture than normal could
be expected with increased snow pack levels in higher elevations of the
Sierra on into Nevada and Colorado. El Nino tends to shift the
jetstream southward and flat over the continental US, favoring
precipitation for the more southerly positioned ski resorts in the
Southwest. But it too causes surface temperatures to rise, meaning the
freeze line will increase in elevation with increased odds for
rain at lower lying resorts. This
is a
preliminary assessment, based on what is known at this time. It
could be ratcheted up or down as conditions in the MJO and the warm
pool
change through the critical Sept-Oct timeframe.
And there
remains the nagging question of whether we have
moved into the Inactive Phase of the Pacific Decadal Oscillation
(PDO). The PDO is in-effect is a 20-30 year cycle of weather than
slightly mirrors El Nino in the active phase and La Nina symptoms in
it's inactive phase. Our thinking is that if we are in-fact in the
inactive phase of the PDO (probably since 2000, and will be for the
next 20 years), then the odds for favorable winter storm generation
conditions are stacked more in favor of La Nina than El Nina, since the
inactive phase of the PDO mimics a weak La Nina. But this is mostly
just pure speculation. And there is other data that suggests that
we have only been in a 'corrective pattern' since the big 97/98 El
Nino. Since that ENSO event was so large and strong, the atmosphere has
been trying to re-establish some form of equilibrium for nearly a decade
since, and this is the first chance since then for a normal pattern to
manifest itself. Our thoughts are the historical record is too
short and it too soon to know with any certainty whether we
are in a down phase of the PDO.
So assuming a weak to moderate Classic flavor of El Nino is in.cgiay and
will continue to hold through the Fall and Winter of 09/10, we
calculate net storm activity will be
greater than normal, with storms lasting longer in
duration and moderately more intense than normal with the
potential to cover more surface area, resulting in generally a larger
fetch of increased duration and more intensity. This should results in
more consistent, larger and longer period surf than has been seen in the
past 3+ years, and perhaps better than anything in the last 10+
years.
(This
forecast is highly speculative and based on historical analysis of past
La Nina/El Nino events and the latest long-range forecast models)
Sea Surface Temperature Anomalies
Courtesy: NOAA OSDPD
Notice a broad area of warmer than normal water
temperatures (yellow and orange) extending along the equator from
the West Pacific all the way east to Ecuador. Also notice the
concentration of the warmest waters off Central America 1.5+ degs C
above normal. This is the location of what is called a Classic El
Nino. This is reasonably similar to what water temps have been
since July, with not much increase or decrease since then. Under
normal conditions this water should be pooled up in the far West
Pacific. The reversal of the warm pool from the west to the east
is caused by strong westerly winds blowing (west to east) over the
Pacific
equator pushing warmer water from the west to the east. These winds
were
caused by enhanced activity during the active phase of the MJO.
Note cooler than normal waters flowing from Africa towards South
America on the equator. This is likely the result of inflow
into the Walker circulation (east to west flow) with the updraft
center over the warm pool off Ecuador, and the exact opposite of
the flow that is occurring in the equatorial Pacific (west to
east). Warmer than normal waters are also pooled up off the Pacific
Northwest in the Gulf of Alaska, while a slightly cooler pattern reigns
over the southern hemisphere.
 |
.
Sea Surface Temperature and Surface Wind Anomalies on the Equatorial Pacific
Courtesy: NOAA PMEL
In the top image notice winds blowing from east to west over the entire
Tropical
Pacific Ocean, the standard trade wind pattern for this time of year.
There is no evidence of reversed trades in this image which would be
associated
with the active phase of the MJO or a Westerly Wind
Burst (WWB). But notice that winds are near slack in the west. In the
lower panel
notice that surface temps are above normal over the equator south
of Hawaii (155W) and slightly
warmer over the entire equatorial region. The arrows indicate the
strength and direction
of wind anomalies, which are trending towards more of a west to east
flow than the normal trade pattern. several time this
year fully blowing west winds had occurred lasting for a week or
longer (a WWB).
 |
20 Degree Thermocline Depth and Position Time Series
Courtesy: CPC NCEP NOAA
(Top Image) The core of warm subsurface water is centered just west of
the dateline and making slow but steady headway to the
east, symptomatic of El Nino.
The thickness of the depth of warm waters in the east has increased, another indicator of El Nino.
(Lower Image) Notice the pronounced pocket of warmer than normal water (2+
deg C below normal) at 165W and 125 meters deep. This is a
Kelvin Wave that is traveling from west to east generated by
a previous Westerly Wind Burst in late July. It typically takes 2
months for a Kelvin Wave to travel from the West Pacific to Ecuador,
where it eventually breaks to surface there generating
the pool of warm water presently holding off Central America.
.
Equatorial Pacific Sea Surface Temperature Forecast
Courtesy: NOAA/NCEP
Notice that the average of many separate runs of the NCEP model suggest
generally another 1 deg C increase in water temperature are forecast
off Ecuador by Jan 2010, consistent with development of a
moderate El Nino.
.
Southern Oscillation Index (SOI)
Courtesy: BOM
The SOI depicts the difference in pressure between Tahiti and Darwin
Australia.
When it is consistently negative (that is surface pressure is lower in
Tahiti
than Darwin Aust), the trend is towards El Nino. And when it is
positive
the trend is towards La Nina. Notice that since February 2009
there was
a steady downward trend, symptomatic of El Nino.
A strong upward flux occurred in July associated with the Inactive
Phase of the MJO, but has since dropped as the Active Phase took over
later in July. Also notice that even within these broad
trends there are distinct
smaller up and down cycles at 30-45 days each. These are pulses of the
MJO. Dips are the Active Phase
of the MJO and rises are the Inactive Phase. The current Inactive Phase
of the
MJO is evidenced by a slight uptick at the tail end of the graph.
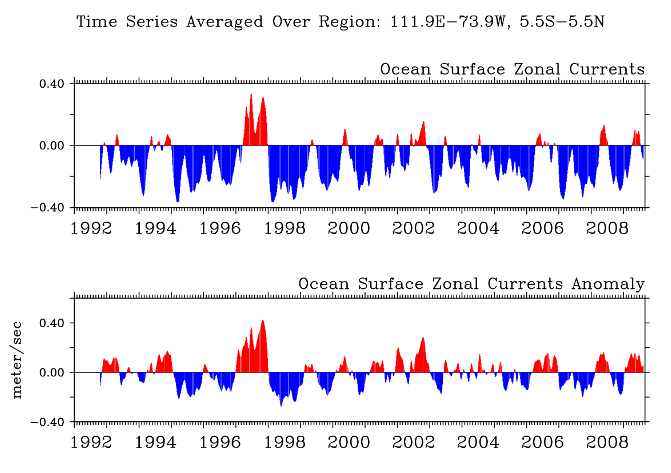
 |
Pacific Countercurrent Anomalies
Courtesy: OSCAR/NOAA
This
image depicts the zonal flow of the Pacific Counter current, which runs
roughly on the equator between the West and East Pacific. When the flow
is east to west (blue) as it normally is, this means nothing,
unless is is tong, then that suggest La Nina. When the flow
reverses and moves west to east (red) that suggest El Nino.
The
top panel depicts the absolute flow and speed of the current. Notice
the '97 El Nino event is obvious, but all others are more just hints or
fragments of something occurring.
The bottom panel depicts
anomalies in the current as compared to historical and seasonal
averages. In this image departures from normal are clearly obvious,
with strong red instances reflective of El Nino and strong blue of
La Nina. Again notice the clear signal of the '97 El Nino event.
Not all red signals necessarily resulted in an El Nino (i.e 2008).
It appears the current change must be sustained over some minimal
duration threshold.
 |
|