Issued:
08/09/2002
Updated
as Warranted
See
ENSO page for Links and Current Data
ENSO Archives
MODERATE EL
NINO BUILDING
Signals Continue Slowly
Strengthening
The first real signs of a developing El Nino became evident during March 2002 and have steadily strengthened their grip on the global weather pattern, particularly in the Pacific. A moderate El Nino seems likely for the Fall and Winter of 2002/2003. This is an upgrade from the previous forecast which projected weak to moderate El Nino conditions.
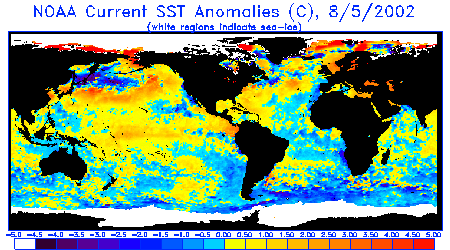
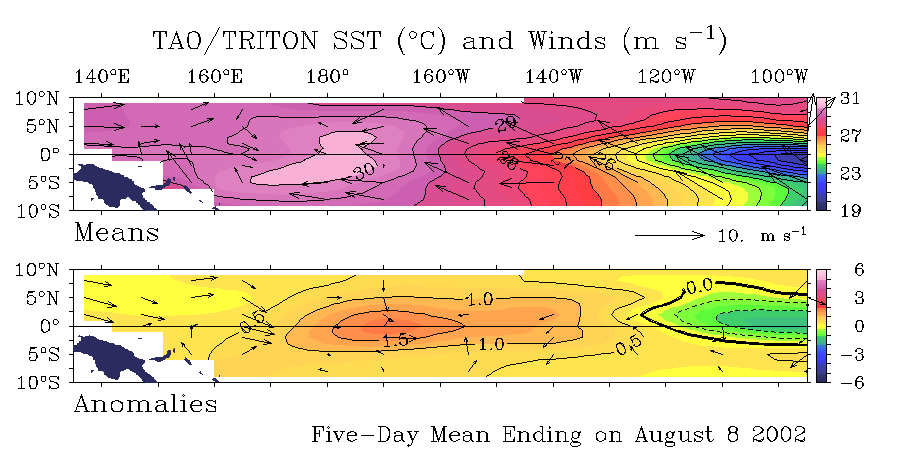
During July and into early August 2002 seasonally adjusted Sea Surface Temperatures (SST) across the equatorial Pacific have ranged from 0.5 to 1.5 degrees C above normal, with the core of the warmest waters positioned just east of the dateline at 170W. This pool of warmer than normal surface water actually extended the whole way to the South America coast in early July, but has given up some of that coverage in exchange for an increase in temperature at it's center. The core warmest area (centered at 170W) is now up to 2.0 degrees C above normal. A small finger of cool water that's being driven by the normal trade wind pattern is trying to hold on from 120W to the South American coast, but it's surrounded by warmer than normal water. Warmer waters extend from Columbia northward up the Central America coast to the mid-Baja peninsula. These are on the verge of making a move towards Southern CA when and if high pressure breaks down off the coast there. Conversely, in the far West Pacific off the Philippines, cooler than normal waters are developing, driven by a shift in the tradewinds consistent what one would expect in an evolving El Nino.
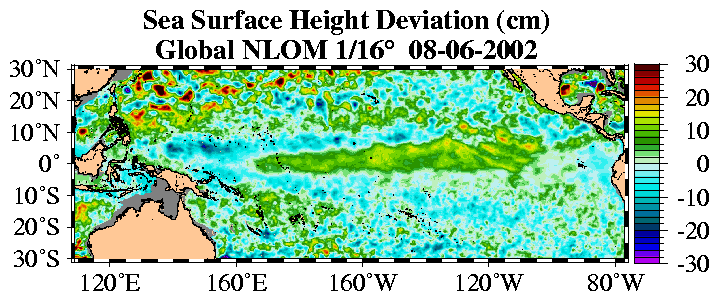
Average trade wind velocity along the equator in the West and Central Pacific remains weaker than normal, typical of El Nino. QuikSCAT imagery and wind anomaly analysis indicates that trades have totally broken down from the Philippines east to nearly the dateline, with winds now consistently blowing from west to east. This is what is fueling the migration of warm surface and subsurface waters eastward and is causing cool water upwhelling in and around the vicinity of the Philippines. This is in sharp contrast to the pattern of the previous 3 years. Sea surface height, that is, the height of the oceans surface relative to 'average' is above normal as well, with a well defined band of ocean heights at least 8 cm above normal extending almost the entire way across the equatorial Pacific from 160E to 110W with the the core of that area ranging from 8-16 cm above normal between 120-160W. This is an increase in areal coverage from even 2 months previous. Water that is higher than normal is also typically warmer than normal, so this measure helps to further confirm the temperature pattern indicated above and the trend of a developing El Nino.
Looking at the larger scale picture, waters of the southern hemisphere east of New Zealand have continued cooling down as strong high pressure dominates there, suppressing the normal winter storm pattern in the South Pacific. Water temperature are 0.5-1.0 degrees C below normal there. Conversely, the north hemisphere continues a warming trend. The Pacific warm water 'horseshoe' pattern that was so prevalent during the La Nina years is gone and has been r.cgiaced by two bands of warm water tracking east. One is over the equator (see discussion above), and a second has developed extending from Central Japan east to just north of Hawaii, then northeast through the Gulf of Alaska into North Canada. This pool is averaging 2.0 C above normal. This is thought to be caused by an abnormally active North Pacific jetstream, driving small low pressure systems further south from the Kamchatka Peninsula east across the open waters of the North Pacific towards the Gulf of Alaska. The lows are pushing warmer water south of the Aleutians further south than normal. QuikSCAT imagery has clearly identified a dividing line between the calm airmass to the south and the eastbound comparatively windier lows to the north in July and early August. Cooler waters have developed north of the dividing line over the western Aleutian Islands, providing more evidence of surface and deep water mixing caused by an unusually active wind pattern there. El Nino typically enhances the North Pacific jetstream in the fall and winter months, and this appears to be evidence of that occurring, though earlier in the year than would be expected. The last remaining La Nina holdout is a small pool of cooler than normal water isolated just along the western US coast (Washington, Oregon and California). This has been caused by a stubborn high pressure pattern centered 1000 nmiles off the Northern Ca coast, driving north winds along the coast and dropping water temperatures. But even this area has significantly deceased in size over the past month, with the warm water train from Japan occasionally making inroads the whole way to the North Ca coast, only to be blown back by a resurgence of the north wind pattern. The local wind pattern appears to be on it's last legs though, and a full scale incursion of warm water there is expected shortly.
The Southern Oscillation Index (SOI) continues to hang in negative territory as is has since March of 2002. This index compares barometric surface pressure between Darwin, Australia and Tahiti. A negative anomaly (signaling El Nino) indicates that lower than normal average pressure is present over the Central Pacific while higher than normal pressure is in the West Pacific. A positive SOI (La Nina) means the pressure pattern is reversed. Starting in March 2002, the SOI went mildly negative and has continued building on that trend. In fact, in the past month (7/14-9/9) the "daily SOI" average has been negative every day but one, with two short bursts of occasional strong negativity. It appears that degraded trade winds and the ensuing warmup of the sea surface water has been in.cgiace long enough and with enough intensity to not only weakly modify the atmospheric pattern above it, but to start building some momentum to that pattern change. The upcoming change in seasons (September) will likely capitalize on the pattern change from a North Pacific storm perspective.
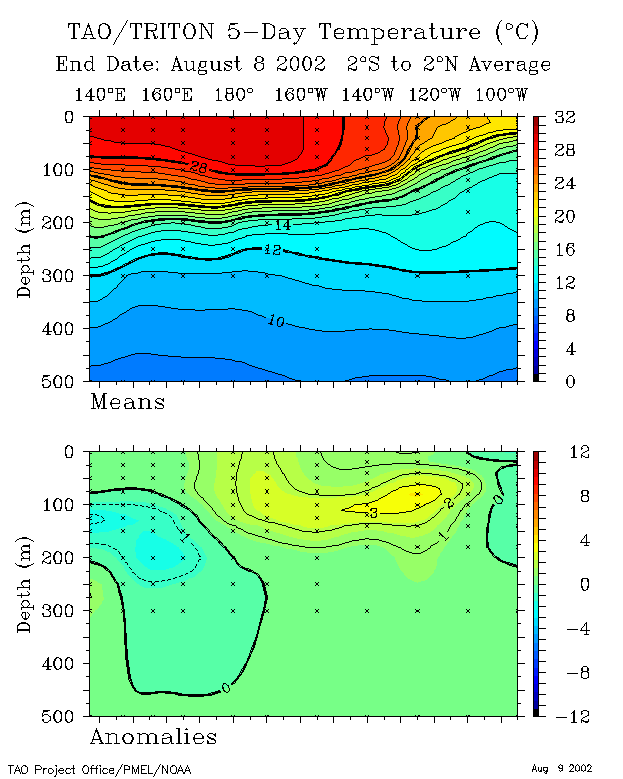
Another key indicator in the evolution of either an El Nino or La Nina event is the depth and profile of the 20 degree thermocline. During La Nina events, warm subsurface water remains pooled up in the far West Pacific near the equator, with cold surface and subsurface waters dominating the East Pacific, resulting in a steep angle from east to west, going from shallow in the east to deep in the west. In El Nino events, as warm subsurface water (i.e. Kelvin waves) migrate towards the eastern Pacific, the angle flattens and becomes more consistent across the equatorial Pacific. Contrary to the previous report, the thermocline angle has actually steepened and lost some ground. This is attributable to the persistent thin band of trade winds trying to hold on off Ecuador. It has been consistent enough to cause some upwhelling off the South American coast to 110 W, and this is reflected in the subsurface temperature profile. There was also a temporary breakdown in the Kelvin wave cycle in late June. (A Kelvin wave is a warm pocket of subsurface water that tracks east, driven by east winds in the West Pacific). But, that breakdown has fully corrected itself and another Kelvin wave appears to be progressing eastward. It is positioned 100 meters below the oceans surface (at 130 W) and is heading towards the South American coast with a temperature 3.0-3.5 degrees C above normal. This continues to point towards El Nino.
The hallmark of this developing El Nino has been the on-again off-again strength of the Madden Jullian Oscillation (MJO). This weather pattern is responsible for the periodic strengthening of the anomalous westerly winds in the West Pacific which drive production of subsurface Kelvin waves, and also drive the SOI negative. As the MJO enters an active phase, El Nino indicators strengthen, and as it fades, so does El Nino. This El Nino has consistently had it peaks and valleys, unlike the El Nino of 97/98 which came on like a bull and didn't stop till it was out of steam. This El Nino's indicators have nowhere near the consistency and momentum of it's predecessor, making it more susceptible to momentary lapses in strength. But, the MJO is known to falter (if become nonexistent) during the summer months and is typically strongest during the change in seasons. The fact that this El Nino has done so well through the core of the summer, one should carefully consider what the outcome will be once we enter the change in seasons (fall), when the MJO comes into it's prime.
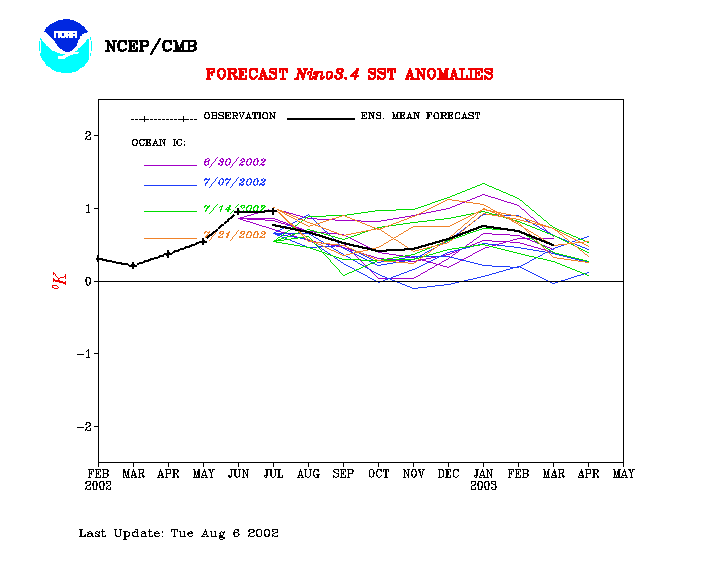
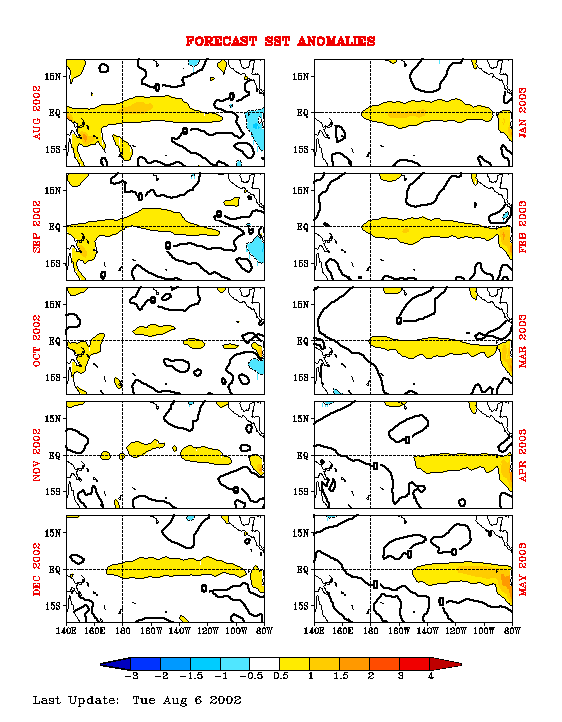
Of 12 ENSO models run in July 2002, 7 are indicating warm conditions becoming dominant near December 2002. Sea-surface temperature forecasts from NOAA/NCEP indicate warm equatorial water conditions through September, fading to neutral, then going warm again in December and holding through May 2003. This outcome seems a bit unlikely though, and suspect some of the models are having troubles resolving the finer details and sporadic nature of this El Nino. As we enter late September, the true nature of this El Nino will likely start to be revealed, heavily influenced by the MJO. So far the trend has been toward steady but slow and sporadic strengthening, and there's little reason to believe that pattern will change.
It will be interesting to monitor the Atlantic hurricane season, to verify the impacts of El Nino there. Of most interest is the downward adjustment in the latest update of William Grays Atlantic Hurricane Forecast (issued 8/7/2002). The new projection is for 9 named storms, 4 hurricanes, 1 intense (down from 11, 6 and 2 respectively). The downward adjustment is partially attributable to the stronger than expected development of El Nino. El Ninos impact on the Atlantic Basin should include relatively few storms making significant headway through the Cape Verde storm corridor (instead being blown northeast by upper level winds or only forming close to the US east coast and tracking quickly northeast toward the Azores). If this happens then one could conclude that El Nino's influence is stronger than assumed. Of course, the usual Pacific indicators would be a more direct measure.
Monitor this situation closely.
LONG-RANGE NORTH PACIFIC STORM AND SWELL GENERATION POTENTIAL FORECAST
Fall/Winter
2002 Swell Generation Potential (for California & Hawaii) = 5.0/7.5
(Scale
is from 1-10 with a 1 equaling low potential and a 10 equal to high potential)
For the remainder of the Northern Hemisphere summer: Anomalously high pressure that has setup east of New Zealand has resulted in one of the slowest southern hemisphere winter storm seasons in recent memory, negatively impacting swell generation there. We expect this trend to continue, if not worsen. It was forecast to be slower than normal, but we did not anticipate the total lack of storm activity in this region. El Nino has yet to fully establish itself off the South American coast, resulting in less tropical activity than expected off Mexico. The window is rapidly closing for storm development there as well.
There still exists the potential for redirection of late season typhoons off Japan towards the open waters south of the Aleutians and towards the Gulf of Alaska, enhancing the probability for extra-tropical storm development. But, the relative lack of tropical storm activity in this area of the Pacific (Philippines and Japan) is of concern. This lack of activity is likely the result of the reversal of trade winds there. In all, there's a lessening chance for this scenario to develop.
Forecast data for the fall and winter of 2002 indicates that a weak to moderate El Nino is likely. As is typical in El Nino events, they tend to a.cgiify the North Pacific jetstream, enhancing the strength and duration of storm systems there. This in-turn enhances the potential for swells to be generated from these storms. Additionally, the presence of warmer than normal water in the North Pacific/Gulf of Alaska will likely remain in.cgiace, which should have some additional enhancing impact on storm generation potential there. Sufficient evidence is present to suggest this will be the case in the fall and through the winter of 2002, with a slightly a.cgiified jetstream and weather pattern already in.cgiace (8/2002).
(This forecast is highly speculative and based on historical analysis of past La Nina/El Nino events and the latest long-range forecast models)
Sea Surface Temperature Anomalies
Courtesy: NOAA NESDIS
Notice a darker core of warm water that extends along the equator from just
east of New Guinea nearly straight eastward to south of Baja, where a small
stream of cooler than normal water is streaming west of Ecuador where the normal
trade winds are still in.cgiace. Warm water also blanches north along the Central
American to Baja Mexico. Warm water also is covering much of the North Pacific
extending eastward from Japan into the Gulf of Alaska. Cooler than normal water
is just off the Philippines in the far West Pacific, east of New Zealand and
over a small area the US west coast branching towards Hawaii generated by high
pressure off the Northern CA coast.
 |
20 Degree Thermocline Depth and
Position Time Series
Courtesy: CPC NCEP NOAA
(Top Image) A core of warm subsurface water that dominated the West Pacific
continues to make solid progress east but is stalled in the Central Pacific.
Notice the wall of warm water at 24 degrees stalled at 120W. This was pushing
eastward but has hit cooler water streaming off Ecuador. (Lower Image) Notice
the pocket of Anomalously warm water at 3 degrees above normal pushing eastward
(a Kelvin Wave) at 120W with more warm water moving in behind. Also notice cool
subsurface water in the far West Pacific
 |
Sea Surface Temperature Anomalies
and Average Surface Winds on the Equatorial Pacific
Courtesy: NOAA PMEL
Notice warmer than normal SST conditions currently (+0.5 degrees C) cover the
balance of the equatorial Pacific from 160E to 125W. A core of warm water to
2.0 C is imbedded at about 170W. Also notice Anomalously neutral winds
over the core of the warm water and rather strong winds from the west over the
entire West Pacific, feeding the warm pool in the Central Pacific.
 |
Sea Surface Height Deviation
Courtesy: NLOM
Notice that seas heights are higher than normal almost continuously along the
equator from 160E to 100W. This is not quite as long as 2 months ago but higher
and wider.
 |
Equatorial Pacific Sea Surface
Temperature Forecast
Courtesy: NOAA/NCEP
Notice that 4 separate runs of the model (started at different times) indicate
water temperatures over the Central Pacific are to remain above normal through
the winter of 2002/2003.
 |
Equatorial Pacific Sea Surface Temp
Forecast
Courtesy: NCEP/CMB
NCEP Model: Notice Sea Surface Temps are to remain above normal through September,
then go neutral through November, then return to warmer than normal December
2002 through May 2003. The cool down projected for October seems a little off
base though.
 |
6349
|
||||||||
|
||||||||