|
|||
|
|||
|
|
|||
|
|||
|
Western Australia Surf Report
This surf report contains buoy data and images that depict the current state of the ocean and atmosphere within the swell window for West Australia. Use this page to track storms, observe arriving swells, and determine winds and tides at your beach.
About Powertools
& Links
For more details see Buoys or Current Weather
Surf Cams
(Arranged from North to South)
Courtesy: Coastaldata
Transport
| Location | Refresh Rate |
| Fremantle Boat Harbour | Every Min coastaldata.transport.wa.gov.au |
| Cables Artificial Surf Reef, Cottesloe |
Every Min coastaldata.transport.wa.gov.au |
| Perth Coastline, Cottesloe |
Every Min coastaldata.transport.wa.gov.au |
| Scarborough Beach, North | Every Min coastaldata.transport.wa.gov.au |
| Scarborough Beach, South | Every Min coastaldata.transport.wa.gov.au |
| Swanbourne Beach | Every Min coastaldata.transport.wa.gov.au |
| Trigg Beach - South | Every Min coastaldata.transport.wa.gov.au |
| Trigg Point - North | Every Min coastaldata.transport.wa.gov.au |
| Hillarys Harbour | Every Min coastaldata.transport.wa.gov.au |
Buoys
(Arranged from North to South)
Courtesy: Coastaldata
Transport
Full Globe
Composite Infrared Satellite Image
Courtesy: SSEC
 |
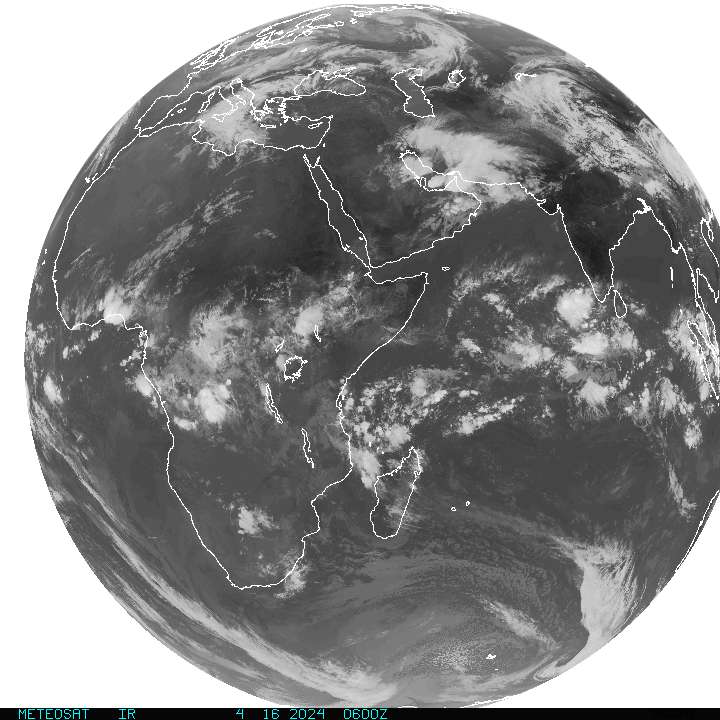
Full Disk
METEOSAT Infrared Image
Courtesy: NOAA
 |
South Hemisphere
Infrared Satellite Image
Image Courtesy: SSEC University of Wisconsin
 |
Australia DiFax Synoptic Chart
Australia 7 Day Surface Pressure & Fronts Forecast (animated loop)
Indian Ocean 7 day Surface Pressure & Fronts Forecast (animated loop)
Western Australia 36 hr Surface Wind Forecast (animated loop)
QuikSCAT
Surface Winds
Courtesy: NOAA OPPT
(Ascending Satellite Pass)
 |
Local Marine
Wind Conditions via QuikSCAT Satellite Based Wind Sensors
Courtesy: NOAA OPPT
(Ascending Satellite Pass)
 |
Indian Ocean
Surface Winds from the AVN Model
Courtesy: NOAA OMB
 |
NOAA 00hr
WaveWatch III Wave Model
Courtesy: Scripps Research Institute
| Height | Period |
 |
 |
NOAA 00hr
WaveWatch III Wave Model
Courtesy: NOAA OMB
| Height | Period |
 |
 |
Tides
(Arranged from North to South)
Courtesy: Coastaldata Transport
| Timor Sea |
| Cape Domett |
| Wyndham |
| Napier Broome Bay |
| Cape Voltaire |
| Shale Island |
| Indian Ocean |
| Derby |
| Broome |
| Port Hedland |
| Cape Lambert |
| King Bay |
| Onslow |
| Exmouth |
| Coral Bay |
| Carnarvon |
| Monkey Mia |
| Denham |
| Geraldon |
| Jurien |
| Perth |
| Fremantle |
| Bunbury |
| Bussleton |
| Cowaramup Bay |
| Augusta |
| South Ocean |
| Albany |
| Esperance |
533
|
|||||||
|
|||||||
