Swell Classification Guidelines
Significant: Winter - Swell 8 ft @ 14 secs or greater (11+ ft faces) for 8+ hours (greater than double overhead).
Summer - Head high or better.
Advanced: Winter - Swell and period combination capable of generating faces 1.5 times overhead to double overhead (7-10 ft)
Summer - Chest to head high.
Intermediate/Utility Class: Winter - Swell and period combination generating faces at head high to 1.5 times overhead (4-7 ft).
Summer - Waist to chest high.
Impulse/Windswell: Winter - Swell and period combination generating faces up to head high (1-4 ft) or anything with a period less than 11 secs.
Summer - up to waist high swell. Also called 'Background' swell.
On
Thursday, September 24, 2015
:
- Buoy 165 (Barbers Point): Seas were 3.3 ft @ 11.8 secs with swell 1.7 ft @ 11.2 secs from 188 degrees.
- Buoy 46025 (Catalina RDG): Seas were 2.6 ft @ 16.0 secs with swell 1.7 ft @ 14.8 secs. Wind calm. At Santa Barbara swell was 0.5 ft @ 15.5 secs from 248 degrees. At Santa Monica swell was 1.7 ft @ 15.5 secs from 209 degrees. Southward from Orange County to San Diego swell was 1.9 ft @ 15.0 secs from 212 degrees.
- Buoy 46012 (Half Moon Bay): Seas were 5.9 ft @ 12.8 secs with swell 3.0 ft @ 13.2 secs. Wind northwest 14-18 kts. Water temp 62.4 degs.
Notes
Buoy 46059 is scheduled to come back on-line in October
Buoy 029 (Pt Reyes) has been refunded. Reactivation imminent.
PACIFIC OVERVIEW
Current Conditions
On Thursday (9/24) in North and Central CA windswell from the Gulf of Alaska was producing surf in the waist to chest high range and textured from the northwest. Down in Santa Cruz small southern hemi background swell was producing surf in the shoulder high.cgius range on the sets and clean though a little wonky from tide. In Southern California up north waves were thigh to waist high and clean. Down south southern hemi background swell was producing waves in the thigh to waist high range and clean but inconsistent. Hawaii's North Shore was flat and a little lumpy from northeast winds. The South Shore was getting background southwest swell with waves waist high or so and clean. The East Shore was smaller with local east tradewind generated windswell producing waves in the thigh high range and chopped from trades.
See QuikCASTs for the 5 day surf overview or read below for the detailed view.
Meteorological Overview
For the North Pacific no swell producing fetch was occurring. Low pressure was fading in the Northern Gulf of Alaska having previously produced minimal swell now pushing into North and Central CA as well as the Pacific Northwest. High pressure was over the Western Gulf ridging southeast but not generating any windswell producing fetch of interest. The remnants of what was Tropical Storm Krovahn was fading east of North Japan. And Tropical Storm Dujuan was east of and between the Philippines and Japan bound for mainland China. Swell from a gale that tracked under New Zealand on 9/12-13 with 32 ft seas is fading in California. Looking at the forecast charts the jetstream is forecast to wake up some over the North Pacific mid-next week feeding a gale over the Gulf producing 20 ft seas targeting the US West Coast. Previous concerns about high pressure taking over the East Pacific have faded some, with only a limited gradient and north winds over North CA on Sat-Sun (9/28) but enhanced trades for Hawaii starting Fri (9/25) and building into Sunday and continuing on from there. But the overriding focus is on long term projections depicting the North Pacific waking up a week out. Down south a gale is forecast moving under New Zealand Tues-Wed (9/30) with 32 ft seas. And of course, El Nino continues evolving with the interest being the slow eruption of massive Kelvin Wave #3 focused just west of the Galapagos.
SHORT- TERM FORECAST
Current marine weather and wave analysis.cgius forecast conditions for the next 72 hours
North Pacific
Overview
Jetstream
On Thurs AM (9/24) the bulk of the jet energy was running over the Northern Bering Sea falling southeast over the Eastern Aleutians into a broad trough over the Gulf of Alaska with winds 90 kts offering only minimal support for gale development there. Still it's coverage looked solid at the moment. In parallel back to the west, a consolidated jetstream flow was starting to take shape inland over Asia and poised to start moving over the North Pacific near Japan. Over the next 72 hours the Gulf trough is to slowly pinch off into Sat (9/26) then evaporate. Of more interest is the development of the aforementioned consolidated jet pushing due east off Japan reaching to the dateline with winds 110 kts, then fading quickly and tracking east-northeast up into the Northern Gulf. No troughs forecast but the overall configuration is to start looking far more positive. Beyond 72 hours the jet in the West Pacific is to build with winds 130 kts on Tues (9/29) with a trough developing in the Western Gulf and a second broader one over the Kuril Islands with both pushing east. By late Wed (9/30) a steep trough with 130 kt winds is to be over the Gulf with the second trough mid-way between the Kurils and the dateline with winds 140 kts feeding it. This pattern would suggest improved support for gale development in those troughs. This is starting to look like the beginning of a transition to Fall with enhancement from El Nino.
Surface Analysis
On Thurs AM (9/24) north windswell from low pressure previously in the Gulf of Alaska on Mon-Wed (9/23) generating 15 ft seas on Monday and then again late Wednesday was starting to hit the CA coast. But swell sizes were only in the 3.0 ft range. High pressure was mostly out of the picture with only 15 kt north winds in pockets along the California coast and trades barely 15 kts limited to directly over the Hawaiian Islands offering little support for local windswell generation.
Over the next 72 hours high pressure at 1032 mbs is to be moving from the North Dateline region southeast into the Gulf of Alaska by Sat (9/26) generating 20 kt north winds over North CA building to 25 kts late and 15-20 kts trades over and just east of the Hawaiian Islands resulting in local short period windswell at both locales. That fetch is to build in coverage Sun (9/27) with 25 kts north winds over North CA and 20 kts reaching south to Pt Conception and 20 kt east winds over and east of the Hawaiian Islands with a cutoff low developing well off California generating 30 kt northeast winds targeting the Islands. More windswell to result. But by Mon (9/28) the high is to start fading as low pressure builds in the Gulf and winds isolated to North CA down to 25 kts and fading out late with 20 kt east trades holding over Hawaii. Windswell fading in CA but holding in HI.
North Pacific Animations: Jetstream - Surface Pressure/Wind - Sea Height - Surf Height
Tropical Update
Tropical Storm Dujuan: On Thurs AM (9/24) this system was 550 nmiles east of the Northern Philippines with winds 55 kts tracking west-northwest. Steady strengthening is forecast while this system turns a little more to the northwest, reaching typhoon strength Thurs PM (9/24) at 70 kts with continued development expected as the west-northwest track solidifies. Winds to peak at 115 kts Sun AM (9/27) positioned over the south most Japan Islands. A slow fade is to set in with Dujuan tracking just north of Taiwan and into mainland China Tues AM (9/29) with winds 85 kts. No recurvature to the northeast is forecast.
California Nearshore Forecast
On Thurs (9/24) a weak high pressure pattern was in control locally with winds light at many locations nearshore. More of the same is expected Friday with 15 kt north winds nearshore along the Central Coast late morning. Building high pressure is expected Saturday with north winds building to 20 kts late. But on Sunday the gradient is to move north with 25 kts north winds over North CA but an eddy flow setting up from Pt Reyes southward. And by Monday even the gradient is to be gone later. No change is forecast until later Wed when north winds start building over Pt Conception at 15-20 kts as high pressure tries to get a toehold though light winds to be from Santa Cruz northward and remaining unchanged into Thursday (10/1). with light winds the norm. building in coverage Sunday. There's some signs the gradient is to start lifting north a little late Mon (9/28) and finally isolated to Cape Mendocino at 30 kts on Tues (9/29) with an eddy flow finally returning. 60 hours of solid north winds will certainly cause upwelling and dropping water temps. The front from the above low is not expected to reach anywhere south of Cape Mendocino.
South Pacific
Overview
Surface Analysis
On Thurs AM (9/24) swell from a gale previously south of New Zealand was fading in California. Swell to be down to 1.8 ft @ 13-14 secs on Fri AM (9/25) with surf 2.5 ft or less. Otherwise no swell producing fetch of interest was occurring.
Over the next 72 hours a pattern of 30-35 kt west winds is to start setting up over most of the South Pacific on the north periphery of the Ross Ice Shelf with one area of 20-25 ft seas resulting at 59S 140W on Sun AM (9/27) but all aimed east with no swell expected to pushing northeast towards our forecast area.
South Pacific Animations: Jetstream - Surface Pressure/Wind - Sea Height - Surf Height
LONG-TERM FORECAST
Marine weather and forecast conditions 3-10 days into the future
North Pacific
Beyond 72 hours high pressure is to remain weak relative to California with no windswell production forecast. But it is to hold north of Hawaii with trades 15-20 kts into Thurs (10/1).
Of far more interest is to be the development of low pressure in the Western Gulf late Tues (9/29) producing 35 kt northwest winds and 20 ft seas at 41N 170W. The gale is to track east into Wed AM (9/30) with 35 kt northwest winds holding and 19 ft seas at 40N 165W. More of the same is forecast in the evening and into Thurs (10/1) with 20 ft seas moving to 41N 150W. If all this happens some 13 sec period swell would result targeting mainly the US West Coast.
Another broad low is to be developing over the Kuril Islands on Tues (9/29) lifting northeast and remaining landlocked with the core pushing up to Kamchatka by Thurs (10/1). West winds are forecast at 25-30 kts. No swell production is forecast, but having low pressure at all in the North Pacific is a step in the right direction.
South Pacific
Beyond 72 hours a broader gale is projected tracking under New Zealand on Tues-Wed (9/30) with a modest sized area of 40 kt southwest winds and seas at 31 ft at 58S 173E forecast Wed AM (9/30). The southern hemi swell production season is winding down.
Details to follow...
MJO/ENSO Update
Kelvin Wave #3 Eruption Area Temps Fade Some
But Temps Warm Along Peru
The Madden Julian Oscillation is a periodic weather cycle that tracks east along the equator circumnavigating the globe. It is characterized in it's Inactive Phase by enhanced trade winds and dry weather over the part of the equatorial Pacific it is in control of, and in it's Active Phase by slack if not an outright reversal of trade winds and enhanced precipitation. The oscillation occurs in roughly 20-30 day cycles (Inactive for 20-30 days, then Active for 20-30 days) over any single location on the.cgianet, though most noticeable in the Pacific. During the Active Phase in the Pacific the MJO tends to support the formation of stronger and longer lasting gales resulting in enhanced potential for the formation of swell producing storms. Prolonged and consecutive Active MJO Phases help support the formation of El Nino. During the Inactive Phase the jet stream tends to .cgiit resulting in high pressure and less potential for swell producing storm development. The paragraphs below analyze the state of the MJO in the Pacific and provide forecasts for MJO activity (which directly relate to the potential for swell production).E.cgianation of data layout below: Major sections are organized in cause-and-effect sequence starting with wind conditions/forecasts for the Kelvin Wave Generation Area (KWGA - equatorial West Pacific) followed by subsurface ocean temperature conditions (i.e. monitoring for Kelvin Waves), then ocean surface temperature conditions (i.e Nino 1.2 and 3.4) followed by atmospheric co.cgiing analysis. The 1st paragraph in each section is new/recent data and is typically updated with each new forecast. The 2nd paragraph, where present, provides analysis and context and is updated as required.
Overview: A strong El Nino is developing. It began its lifecycle in late 2013 as a primer WWB and Kelvin Wave developed. Then in early 2014 a historically strong push by the Active Phase of the MJO resulted in a large Kelvin Wave, and anomalies continued in the Spring into early Summer transporting more warm water eastward. But the cycle faltered in July due to a protracted bout of the Inactive Phase of the MJO which enabled the upwelling phase of the Kelvin Wave cycle to manifest driving cooler water east, muting warm water buildup along the Ecuador coast. Still the warm water pipe remained open, but surface temperatures near the Galapagos never recovered and any atmospheric momentum was lost. Then in early 2015, another historically strong push from the MJO occurred, effectively a repeat of the early 2014 event, invigorating the warm water transport process and, adding more heat to an already anomalously warm surface pool off Ecuador. That pool has been building steadily in spurts ever since. The paragraphs below describe the current status of various El Nino indicators, followed by a few paragraphs that tie all the pieces together and provide our analysis of what is to come.
KWGA/Equatorial Surface Wind Analysis & Short-term Forecast: As of Thurs (9/24):
Analysis from TAO Buoys: Down at the surface the TOA array (hard sensors reporting with a 24 hr lag) indicated moderate west winds (not anomalies) from 162E-180W on the equator and north of there. This is consistent with the pattern from days past. A pocket of 12 kt west winds was centered at 7N 152E per the 00hr GFS with light winds (8kt or less) in the heart of the Kelvin Wave Generation Area. Anomalies were strong from the west from 162E to 175W on and north of the equator. This is a little smaller area than days past. This pattern has been in control in some form since 9/2 and intensified some 9/17 and is holding to date. It is locked over the eastern half of the KWGA, which is a normal configuration as El Nino matures. Previously, west anomalies were steady for a 29 day window (7/19-8/19) and followed directly behind a very strong WWB burst (third of the year) that was associated with a robust Active Phase of the MJO (historically strong) 6/24-7/17 (nearly 2 months of west anomalies or stronger). Starting 9/2 a steady Westerly Wind anomaly pattern set up from 160E over the dateline intensifying some 9/17 and is holding through today.
1 Week Forecast: Moderate west anomalies are forecast from 135E to 170W (and further east than that) with a pocket of stronger anomalies near 175E forecast to hold to 9/27 then fade a little and move east to 140W. The GFS model depicts west winds in the Intertropical Convergence Zone up at 6-9N (reaching south to 3N) fading out on Sat (9/26) as tropical activity there moves west and out of the area. After that a dead wind pattern is forecast other than east winds 10 kts tucked right up along the north coast of New Guinea. In effect west anomalies to continue, perhaps covering a little less area. This remains a great situation. No east anomalies have occurred this year in the KWGA, not one day, and none are forecast. The thought is these anomalies are continuing to push warm water from the West Pacific to depth and though not generating a distinct Kelvin Wave, are filling the semi permanent reservoir already present west of the Galapagos.
A huge WWB occurred in March followed by a second smaller one (9 day duration) in early May with weaker but still solid west anomalies continuing after that through 6/10. Anomalies faded to neutral for 8 days through 6/18 as the Inactive Phase of the MJO interfered with the pattern (the first such event of the year), then weak westerlies started again on 6/18. A significant WWB, the strongest of the year so far, starting on 6/26 peaking near 7/4 but held nicely through 7/17 (22 days), the result of a historically strong Active Phase of the MJO which produced a strong and large Kelvin Wave, the third this year and the strongest by far. Moderate westerly anomalies redeveloped 7/29 when a Rossby Wave started interacting with the building El Nino base state, enhancing the westerly flow, developing a mini-WWB at 175E through 8/5. And westerly anomalies continued through 8/19. That is nearly 2 months of non-stop anomalies if not out and out west winds (6/26-8/19). From 8/19-8/25 lesser westerly anomalies occurred and those were mainly east of the KWGA, with dead neutral anomalies in the West KWGA. West anomalies started rebuilding on 8/26 and turned to legit west winds up at 9N on 9/3 and held in some fashion up there into 9/22 while calm winds held in the KWGA proper. West wind anomalies at the surface are the hallmark of the Active Phase of the MJO and El Nino and drive Kelvin Wave production.
Kelvin Wave Generation Area monitoring model here
Longer Range MJO/WWB Projections: As of 9/24:
OLR Models: Indicate a dead neutral signal over the far West Pacific typical of a maturing El Nino. The Statistic model suggests no MJO pattern and that is to hold for for the next 15 days. The Dynamic model depicts the same thing. In essence no MJO influence is forecast. This is typical of the pattern when an El Nino base state strengthens.
Phase Diagrams 2 week forecast (ECMF and GEFS): Both models indicate a dead MJO signal, not unexpected. The GEFS suggest some Active Phase development possible over the Indian Ocean 2 weeks out, but that is not believable.
40 Day Upper Level Model: It depicts a weak Inactive Phase in the far West Pacific tracking east. In reality, this pattern has been on the charts for weeks now and consistently fails to materialize. It is suspected the stronger El Nino base state is in control, but exhibits an Inactive-like MJO pattern over the far West Pacific, with an Active-like pattern over the dateline and points east of there, but not moving. The model thinks it's a real Inactive Phase in a normal year in the West Pacific and tries to move it east. We are for the most part ignoring this model.
CFS Model beyond 1 week (850 mb wind): A weak Inactive Phase of the MJO is forecast fading out over the next 3 days 9/27 while tracking east. A weak push of the Active Phase of the MJO is expected to start 9/29 and holding through 11/3. We'll believe it when it happens. An Inactive Phase to follow 11/4-12/6 with perhaps another Active Phase behind that. Rossby Wave activity is to be non-influential. In essence all oscillations are to be weak. Steady state west anomalies are forecast from now into at least mid-December with a slight hint of eastward movement of the core of those anomalies in late Dec. The El Nino base state is now the primary driver of Westerly Anomalies from here forward. No easterly anomalies are forecast. The question is, will another Kelvin Wave result or will the anomalies at least continue to fuel the subsurface warm reservoir into Dec? We think probably so. Is it possible this El Nino might last longer than previously expected? Too early to tell. At a minimum, three more months of west anomalies are forecast (per the model). Tropical systems have the best chance of constructively interfering (enhancing) westerly anomalies from here forward. We're on autopilot now. It doesn't get any better than this.
CFSv2 3 month forecast for 850 mb winds, MJO, Rossby etc
Subsurface Waters Temps
TAO Array: (9/24) Actual temperatures remain impressive. A tongue of 29 deg temps are pushing east from 140E to 135W with a pocket at to 30 degs embedded at 155W. The 28 deg Isotherm reaches east to 124W. Anomaly wise +2.0 degs anomalies are fully bulging from the dateline eastward and +4 deg anomalies cover from 154W eastward (holding), the direct effects of the massive June-July WWB. A large warm reservoir at +5-7 deg above normal is starting to erupt into the Galapagos. That reservoir is holding coverage with peak +7 degs anomalies centered at 110W (holding) with +5 deg anomalies extending east from 139W to Ecuador (holding). This pocket is a mixture of warm water from a WWB in early May merging with water from the most recent strong WWB in late June-July. The pipe is open. And warm warm water continues falling to depth near the dateline and into this reservoir. Warm waters appears to be erupting west of the Galapagos with the hi-res subsurface animation (9/20) depicting near-surface movement of the warm pool from 110W-->95W. A tiny backdraft cool pool east of the Galapagos is gone. The Upwelling phase of the Kelvin Wave Cycle is over. It's about time.
Sea Surface Height Anomalies (SSHA): (9/20) It is holding solid depicting 0-+5 cm anomalies over the entire equatorial Pacific starting at 178E (expanding slightly). Peak anomalies were +15 cm extending from the Galapagos (85W) to 140W (easing east). +5 cm anomalies are pushing into Ecuador. This is a good upgrade and indicates the arrival of the 3rd Kelvin wave with peak heating subsurface from the Galapagos westward. All this is indicative of a wide open pipe with a large Kelvin Wave in flight. This is a classic major El Nino setup.
Upper Ocean Heat Content: As of (9/20) it indicates +0.5-1.0 deg anomalies are tracking east between 178W and the Galapagos (easing east). +1.0-1.5 degs have expanded some from 158W eastward. +1.5 deg anomalies are doing the same expanding west from 151W. This westward expansion is very interesting. A large pocket of +2.0 degs anomalies are at 141W-->88W (easing east slightly) with a large pocket of +2.5 deg anomalies between 123W-->95W (easing east). A previous pocket of cooler 0.5-1.0 degs anomalies between the Galapagos and Ecuador is gone suggesting the Upwelling Phase is over.
A strong Kelvin Wave impacted the Ecuador Coast in May-June with a second somewhat weaker one impacting it in June. And now a third is erupting, but westward di.cgiaced just west of the Galapagos. A previous pause in warming near Ecuador occurred starting mid August, attributable to the Upwelling Phase of the Kelvin Wave Cycle, but ended on 9/20. The subsurface configuration suggests there are 2.5+ months of warm water in this reservoir (till Dec 15) and some of that water is extremely warm (7 degs above normal). The peak was forecast to occur roughly on 10/4 in the Nino 1.2 region but we are revising that to 11/4 now given stalling effect the Upwelling Phase had. And westerly anomalies continue in the KWGA pushing more warm water to depth. So the question becomes, is this third Kelvin Wave the final one, or will another follow? Or maybe just a continued r.cgienishment of the warm pool will continue for the next month or more. We all hope the answer is more is on the way. But that is entirely dependent upon how strong the El Nino base state really is. All data suggests this is a historically epic setup.
Surface Water Temps: The more warm water in the equatorial East Pacific means more storm production in the North Pacific during winter months (roughly speaking). Cold water in that area has a dampening effect. Regardless of what the atmospheric models and surface winds suggest, actual water temperatures are a ground-truth indicator of what is occurring in the ocean.
Satellite Imagery
Low-res: (9/24) Overall the picture is improving, and dramatically. Warmer waters are building up into Central America and south into Peru and filling the Nino1.2 region nicely. The warm water signal covers the entire equatorial Pacific from the dateline eastward. And the pattern is getting better defined and is exhibiting more concentration compared to previous days data. The overall signatures is the strongest of any point so far this year and of any time since mid-July 1997. Compared to '97, 2015 anomalies are warmer in the Nino3.4 region, but have less concentration in Nino1.2. Surprisingly coverage south of the equator is nearly on par with '97. Overall, the current expansion of water temps is impressive. Along the West African Coast, cool water continues there. Very warm water continues off the US West Coast and is holding and extending west the whole way to Japan but unrelated to this years El Nino, attributable to the building warm phase of the PDO. Slightly cool water is over North Australia extending north of New Guinea to the dateline. The cool wake of previous tropical systems are evident off Japan and the Philippines. Warming water continues near Madagascar suggestive of a building Indian Ocean Dipole.
Hi-res Nino1.2: (9/23) Temps are rebounding significantly and are nearly to where they were at peak warming in this region on 7/14. +2.5 anomalies fill the Ecuador-Galapagos region with a small pocket to +4.0 along the immediate Ecuador coast. A cool pocket is just north of the Galapagos. Overall, this warming pattern is very good news and suggests previous cooling in this region was not completely due to westward di.cgiacement of this years event, and was attributable to the upwelling phase of the Kelvin Wave Cycle. But we are not giving up on the though that this years event is westward di.cgiaced (see Nino 3.4 below).
Hi-res 7 day Trend (9/23): This chart depicts much warming occurring in the south end of Nino1.2 off Peru and Chile, while slight cooling is occurring on the equator either side of the Galapagos.
A warm water regime started in this region in late April and built steadily there, peaking between the Galapagos and Ecuador on 7/14 as Kelvin Wave #2 reached it's maximum. Then temps started fading from 7/14-7/30. From 7/31-8/13 temps between Ecuador and the Galapagos stabilized, then crashed heavily starting 8/13 finally bottoming out 8/17, perhaps associated with backdraft from Massive Kelvin Wave #3/Upwelling Phase of the Kelvin Wave Cycle. A slow warm up started 8/23 and progressed nicely through 9/6 before falling back some, then started rebuilding again on 9/17, and fast. By 9/22 temps had almost fully rebound to 7/14 levels.
Galapagos Virtual Station: (9/23) This station spiked dramatically through 9/16 with anomalies moving from +4.1 (9/12) to +5.3 (9/16), flirting with peak temps received back in 6/14 (+5.5). But a bit of a fade occurred 9/17-18 down to +4.5 and then down to +4.4 on 9/21 and 3.8 degs on 9/23. A quick look at the Nino1.2 hi-res imagery e.cgiains the situation, with the last little pocket of the upwelling phase cooler waters moving into the East Galapagos. Previously a solid reading occurred on 5/23 at +4.59 degs suggesting the first Kelvin Wave generated in Jan-Mar had arrived, then built to +5.45 degs on 6/14. Temps faded from that high peak down to +4.1 degs in late June then rebuilt up to +4.94 on 7/17. Then a fade set in, down to +3.1 degs as of 7/31 and bouncing from +3.1-3.5 through 8/7, then falling dramatically to +2.0 on 8/10 and held at +2.1-2.3 degrees 8/14-8/19. Temps built to +2.7-3.2 8/22-8/27 and up to +3.5 on 9/5 then down to +3.2 degs on 9/9. A dramatic rise started 9/12 pushing up to +5.3 on 9/17.
Hi-res NINO 3.4: (9/23) The latest image remains impressive, but has backslid some. A solid pool of warm surface water remains unbroken advecting west from from the Galapagos westward with solid +2.25 degs anomalies from a previous Kelvin Wave reaching west to at least 160W. Within that, 3 pockets of +4-5 deg anomalies are present west of the Galapagos at 97W, 103W and 116W and advecting west. Kelvin Wave #3 is starting to rage. Total coverage of anomalies continues to build, but the overall intensity of this warm pocket west of the Galapagos has faded in the past 5 days. Perhaps the focus of the eruption is going to move east some? It's hard to tell. One would think this eruption site would continue to stay active, but it instead appears to be backing off. Within a well we'll know more.
Previously +2.25 anomalies reached to 133W on 7/16 and then 138W (7/31) pushing to 149W on 8/10 and 158W on 8/15 and filling the area to 160W on 8/18. This is advection west of warm water resulting from eruption of the 1st and 2nd Kelvin Waves earlier this year. And the third one is just starting to present.
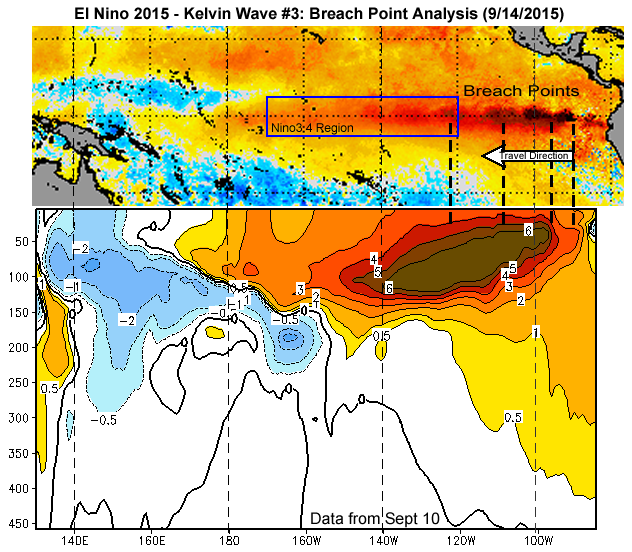
SST Anomalies on 9/14/2015 and what is driving them from below.
Other Sources
TAO Data: +1.0 anomalies are in control over the entire equatorial East Pacific, the warmest in years, advecting west from the Galapagos covering the entire area west to the dateline and beyond (holding at 175E). We're monitoring the +0.0 anomaly line on the equator to see if it's moving east. Today its at 160E (unchanged). +1.5 deg anomalies reach to 177W (easing east). There is also a massive embedded area of +2.0-2.5 deg anomalies extending from the Galapagos to 162W (expanding west) with +3.0 deg anomalies depicted embedded in it from 105W to 133W (easing east). Overall the warm water signature is holding, and very impressive at this time. We expect more expansion in the next 2-3 months
Nino1.2 Index Temps: (9/24) Temps are on the rise slowly at +2.1 today. They bottomed out at +1.265 degs on 9/15, This rise is consistent with what is being indicated in the hi-res Nino1.2 imagery. Previously temps hovered at +2.1 degrees early June then spiked reaching +3.0 degs on 7/3, faded, then spiked again on 7/13 at +3.0 degs and yet again at +3.0 degs on 7/22. Temps fell to +1.9 degrees on 7/27 and bottomed out at +1.0 degs on 8/20 at the height of the upwelling phase of the Kelvin Wave Cycle. Then temps started building to +1.3 on 8/26 and +1.7 by 8/29 and to +2.0 by 9/8 before falling, down to +1.265 degs on 9/15. They started rising after that as Kelvin Wave #3 started arriving.
Nino 3.4 Index Temps: Temps are fading today at +1.732, having spiked on 9/17 at +2.077. The all time peak for this event was +2.24 degs on 8/23 (one day). We are approaching that level again in fit's and starts. By any normal standard we are in Strong El Nino. We expect these temps to continue upward for the foreseeable future. In '97 for Aug the monthly anomaly in Nino3.4 was +2.02 (OISST.v2) The data for this months data (Aug) was +2.06. They are even. For OISSTv.4 its +1.74 ('97) and +1.49 (2015). This months data is just a bit behind '97. Based on what is happening in the Nino 1.2 region, with the 3rd Kelvin Wave apparently starting to erupt there, the thought is additional warming is poised to occur in Nino3.4 with a 1 month delay. Water temps previously held in the +1.0-1.3 deg range since mid-April, then started building pushing +1.5 degs on 6/30, held then crept up, peaking at +1.75 degs on 7/19 and +1.7 degs on 7/29, pushing +1.8 of 8/10 and +2.24 on 8/23.
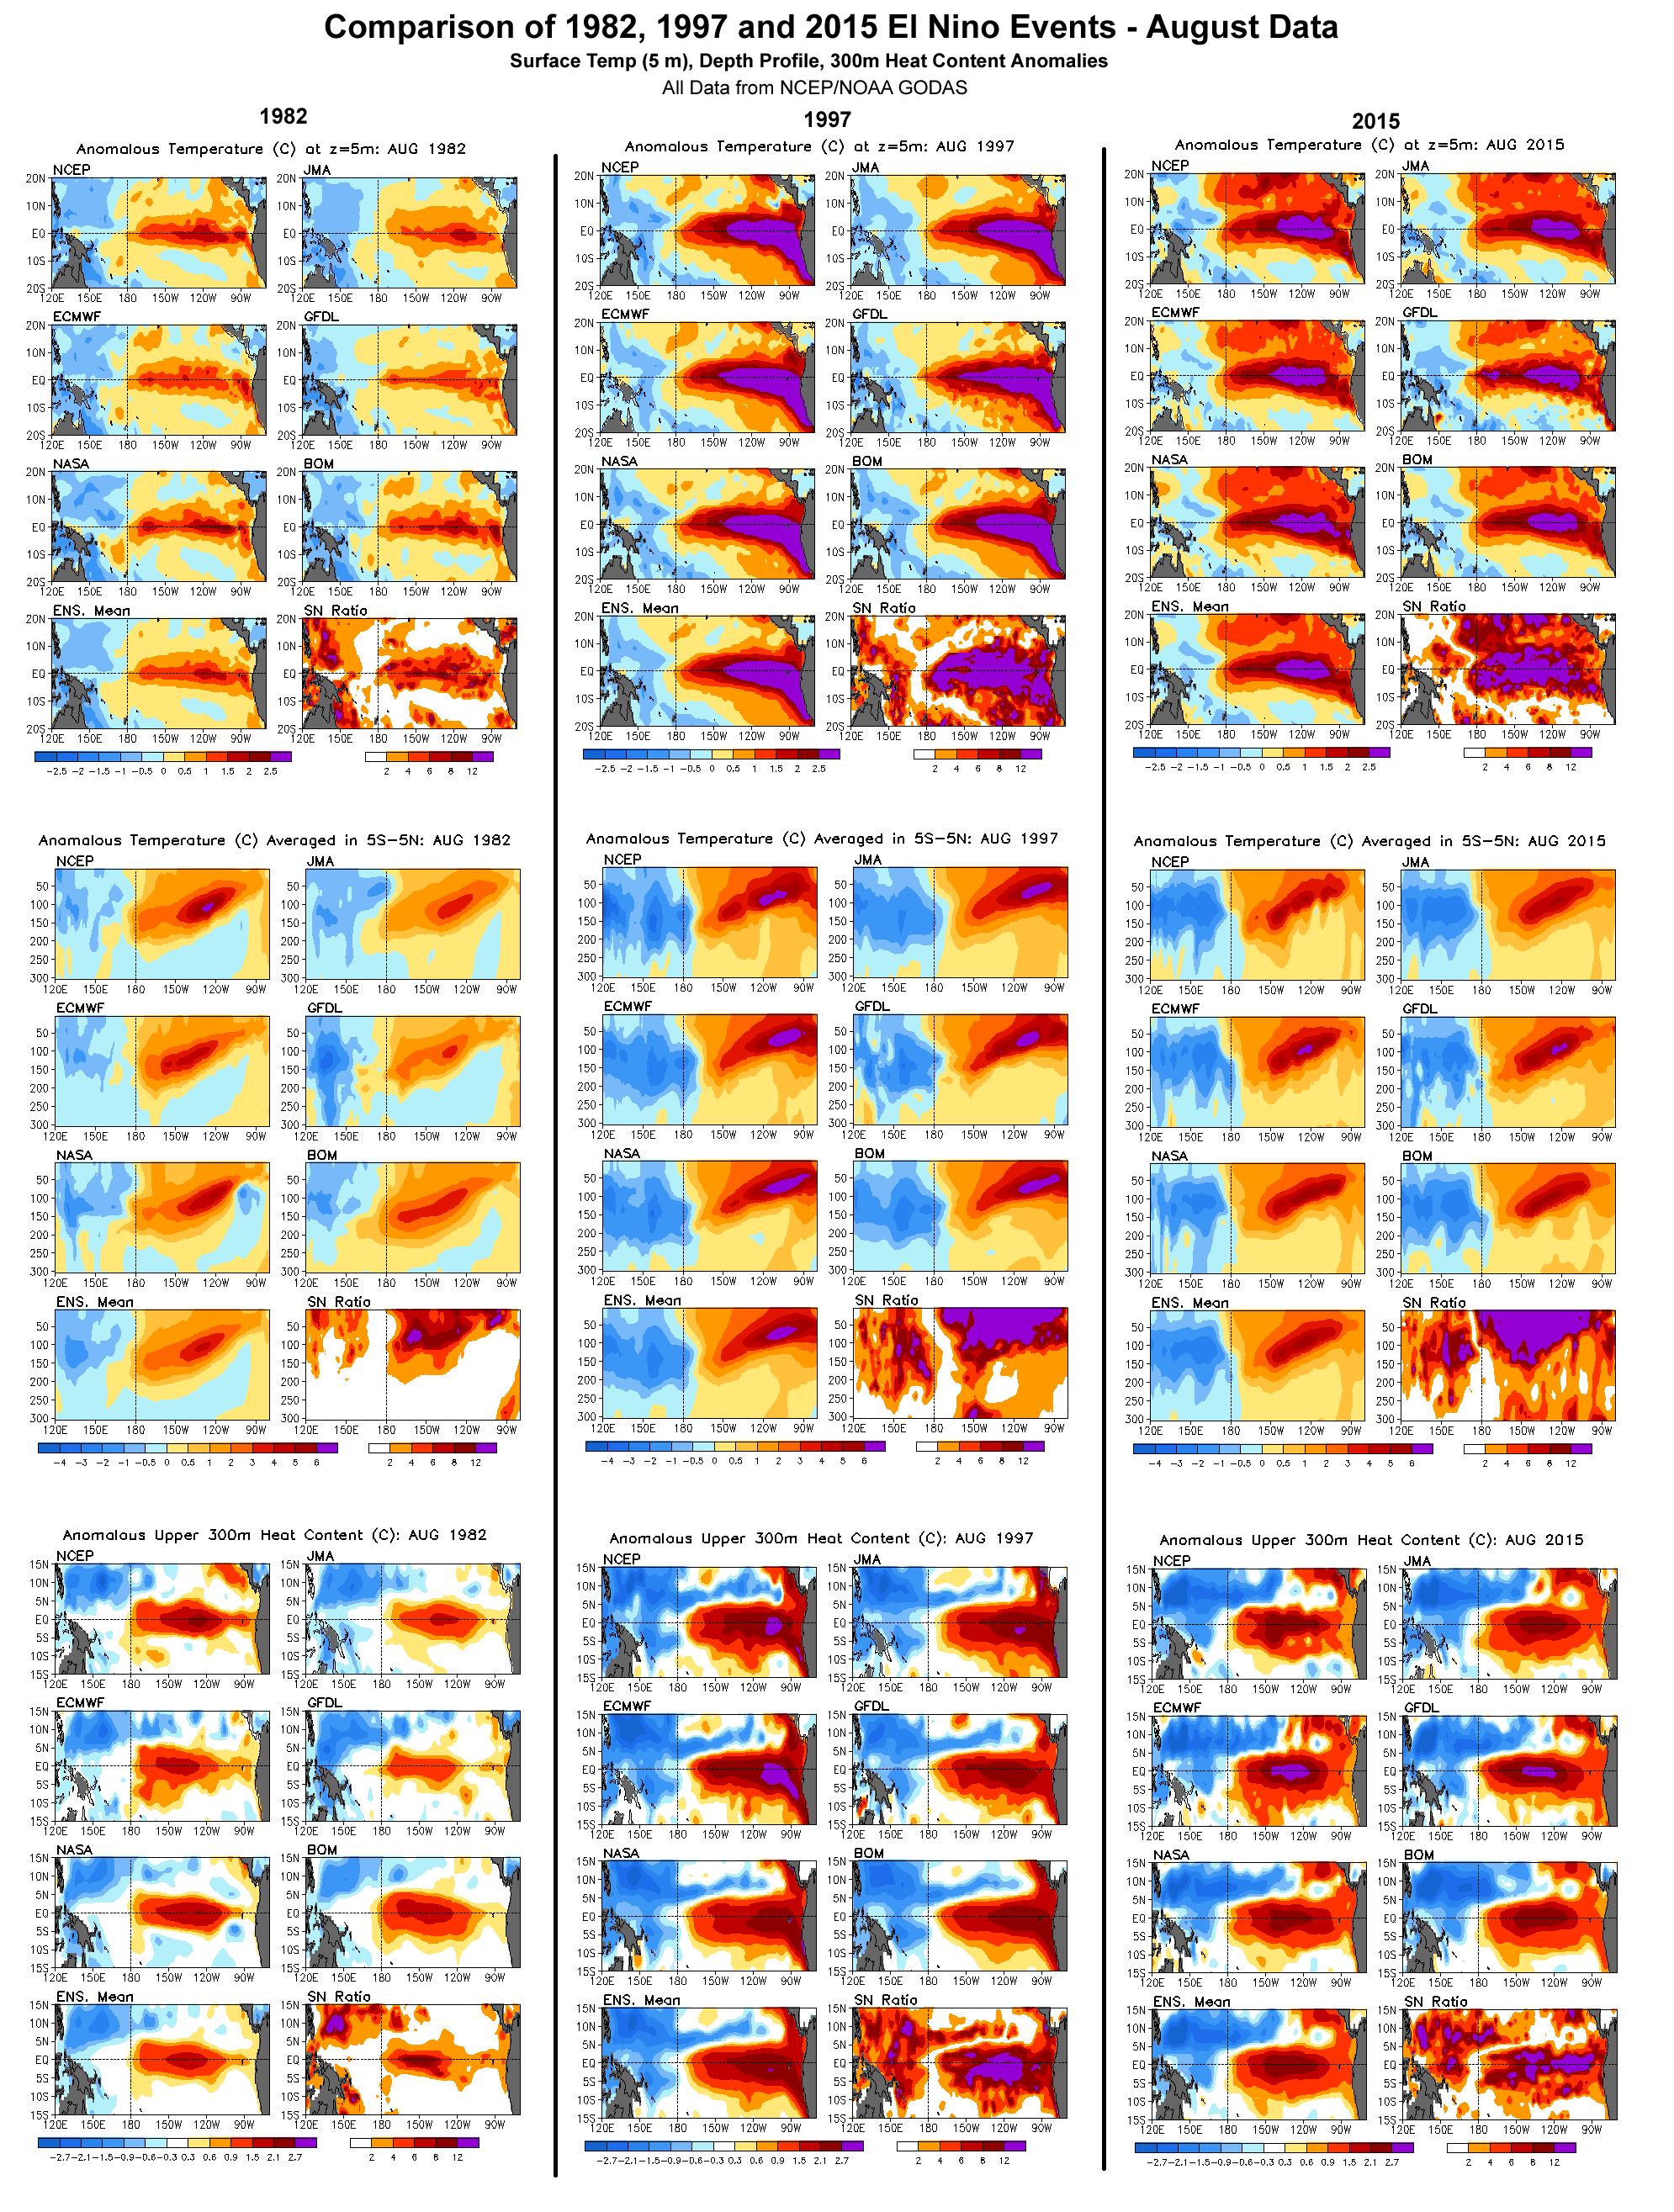
Special Analysis (9/3): We performed an analysis of Nino1.2 and Nino3.4 weekly anomalies temps using OISST.v2 data. A very interesting pattern emerged: Nino1.2 temps are averaging lower in this years event to date compared to '97, but the Nino3.4 temps are higher. Specifically the Nino1.2 anomaly average for the period 4/30-8/26 for 2015 is +2.42 while in '97 is was +3.43. Meanwhile west of there in the Nino3.4 region, the average for 2015 is +1.49 while it was +1.42 in '97. This suggests the 2015 event is more focused west of the Galapagos as compared to '97. And looking at the Nino4 region, the same pattern emerges. A si.cgie view of SST anomaly charts clearly indicates the same thing. There was much more heating in the Galapagos region in '97, while in 2015 the warmth is di.cgiaced more to the west.
If you narrow the focus to just the timeframe July through August the same trend emerges with Nino1.2 anomalies +1.52 degs warmer in '97 compared to 2015 and Nino 3.4 temps almost dead even (-0.03 in 2015).
Regardless, the working theory is this years event is westward di.cgiaced somewhat like the '82/83 super El Nino event. The main evidence for this is the eruption of Kelvin Wave #3 west of the Galapagos. Though that eruption is fading some now, and with no evidence to suggest peak eruption is occurring in the Nino1.2 region proper (yet), we will continue with this theory. This suggests the Walker circulation is not di.cgiaced as far east as in '97 but more like '82/83. At this time we're unsure what the effects on rainfall would be. Total rainfall in San Francisco in '82/83 was 38.17" (+16.38") versus 47.22" in '97/98 (+25.43"). The long term average is 21.79". In LA in '82/83 it was 31.28" (+16.47) versus 31.01" in '97 (+16.2"). Long term average 14.81". Regardless, both events were well above average. This also suggests the core of storm production will be north of the most warming. So rather than the Eastern to Central Gulf of Alaska being the focus, it might be more in the Western Gulf. This is actually a good thing relative to California by perhaps giving resulting swells more room to groom themselves before hitting the coast. This might bode not so well for Hawaii, with large stormy conditions the result. Of course, this is just speculation at this time.
Pacific Counter Current: As of 9/16 the current was moderate but not overly impressive. The current is pushing strongly west to east over the west equatorial Pacific north of the equator from 130E to 155W, and still solid but fading while pushing west to 130W before fading out at 90W. A stream of weak to modest east current was just south of the equator from 110W to the dateline. Anomaly wise - modest west anomalies were spread mostly north of the equator over the West Pacific, with a strong pocket north of the equator from 170E to 150W, then fading with another pocket at 100W. One pocket of east anomalies was indicated south of the equator from 140W to the dateline. This is not impressive but not unimpressive either. Compared to the '97 El Nino at this time, there is no comparison. In '97 the current was raging east from 130E to 130W mainly north of the equator.
SST Anomaly projections
CFSv2 model - PDF Corrected: For the model run 9/24 for the Nino 3.4 region, peak temperatures for this event have stabilized. Water temps are at +1.75 deg C (verified at 1.7 degs today) and are to fade some to +1.75 degs by Oct peaking at +1.85 degs by Nov, then dropping off. Considering temps in Nino3.4 now and the size of the new Kelvin Wave below, we suspect this projection is well on the low side. Uncorrected data has stabalized suggesting a peak to +2.4 degs in Nov. We'll venture a guess of somewhere around +2.3 degs for a one month peak in Oct-Nov but suspect that might be on the low side.
IRI Consensus Plume: The mid-Sept Plume has upgraded again, suggesting peak temps between +2.1 degs (Statistical models), +2.5 degs (Dynamic) with the CPC consensus at +2.45. The mid-July consensus was spread between +1.5-2.0 degs and the mid-Aug between +2.0-2.5 degs. See chart here - link.
If one is to make a direct comparison of the 2015 event to '97 at this time of year based on the areal coverage of water temps, there is no comparison. '97 imagery leaves this years event in the dust. The '97 event built non-stop from this point forward (in terms of areal coverage). Instead, the 2015 event, though warming nicely with comparable to stronger anomalies in Nino3.4 and Nino4, is weak in Nino1.2 and the coverage of warm waters is a worm in this area compared to '97s mammoth coverage. A clear and significant downgrade occurred in the Galapagos area 8/12-8/20 the result of a pause in upwelling of warm water in that region, a break between the first and second Kelvin wave eruptions and the third poised just off Ecuador. It trued to rebuild then fell back on 9/8 and then started rebuilding 9/15. The good news is concerns about these cooler waters advecting west and impacting temps in the Nino3.4 region are gone, with regent warming from the 3rd Kelvin Wave already eliminating those cool pockets. And things are just getting started. Peak temps in western Nino 1.2 expected 10/4 then advecting to Nino 3.4 on 11/4.
Atmospheric Co.cgiing Index's (lagging indicators rather than driving oceanic change):
Daily Southern Oscillation Index (9/22): Was falling from -24.30. Of note: The 97 El Nino had daily values at -40 to -50 in early Nov with one spurt to -76 Jan 30-31st.
30 Day Average: Was falling from -15.94. The lowest point in years was achieved -20.95 on 8/21, with the previous lowest at -20.49 on 7/18/15.
90 Day Average: Was rising from -16.82. The peak low was obtained on 9/16 at -18.56. This is the critical threshold we've been anticipating (values -18 or lower), providing yet more evidence of strong atmospheric co.cgiing. But we had hoped it would hold there. It has not. It has been at or below -10.0 since early July and on a steady fall ever since, bottomed out at a low reading on 8/5 at -14.17, then beat it on 9/2 at -15.23, and peaked (9/16) at -18.56 (peak low of the year so far).
Trend (looking for negative SOI numbers, indicative of the Active Phase of the MJO or El Nino): The near term trend based on the daily average was indicative of a building El Nino base state. The longer term pattern was indicative of a steadily building El Nino base state.
SOI Trend - Darwin (looking for high pressure here): Moderate high pressure was in this area and expected to hold into Fri (9/25) then fade some, but not give way to any lower pressure through Thurs (10/1).
SOI trend - Tahiti (looking for low pressure here): Solid low pressure was south of Tahiti on Thurs (9/24) with a secondary low forecast moving into the area on Sun (9/27). By Tues (9/29) a higher pressure pattern is to take root.
SOI 1 week Forecast: The net result is to be a trend of falling or well-negative SOI values through at least Tues (9/29). This is exactly what we want to see. A rising SOI to follow.
SOI Analysis: During El Nino, the SOI functions as a measure of how well the ocean and atmosphere are co.cgied. Current numbers suggest good but not great co.cgiing, but getting better footing slowly but steadily (notice the 90 day average trend). This pattern is to only change for the better as the El Nino base state builds as we move into Fall. A consistent 90 day average of -18 is our target, indicative of a strong El Nino.
Southern Hemi Booster Index (SHBI) Analysis (which is theorized to supercharge a developing El Nino): Per the past 5 day 850 mbs anomaly charts, a weak but persistent south flow has been in effect in the East Australia region. Per the GFS model that flow is to persist into Mon (9/28), fade some, then return on Wed (9/30). It is high pressure over Southeast Australia that sets up the southerly surface flow. South and southeast wind anomalies have been in this region off and on for weeks now (previous run 7/29-8/10, this run 8/13-8/18), then returning consistently 9/18. The SHBI appears to only be slightly influencing El Nino development, but we have no hard numbers to confirm.
ESPI (like SOI but based on satellite confirmed cloud cover): (9/24) Today's value continues rising to +2.20, up from +1.87 on 9/18 and effectively unchanged since 9/5 (+2.07). The ESPI was steady in the +2.5 range through 8/10, then began falling, to +2.42 on 8/18 and bottoming out at +1.78 on 8/26. It started rebuilding on 8/29 at +1.89 holding at +1.87 on 9/18 and up to +2.2 on 9/24. Historically the peak of the '82 El Nino was +2.2 and the '97 event +2.85. This suggests the '15 El Nino is reasonably well co.cgied with the atmosphere, more so than some of the other indices indicate.
Multivariate ENSO Index (MEI) (Aug) The current ranking is up hard at +2.37 or up 0.39 standard deviations (65). The July MEI was 1.97 SD (65). At this same time in '97 the ranking was 3.00 SD (66) and in '82 it was 1.85 SD (62). So we're between the '82 and '97 events but close to '97, in strong El Nino territory presumably moving towards the Super El Nino range. The top 5 events since 1950 in order are: '97, '82, '91, '86, and '72 with '97 and '82 classified as 'Super El Nino's' because they reached 3 standard deviations (SD) above normal. '91 and '86 were at about 2.2 and 2.1 respectively with '72 peaking at 1.8 SD's above the norm. We've already beat all those. Suffice it to say we are somewhere between '82 and '97 in term of of atmospheric co.cgiing per this index. Most impressive.
North Pacific Jetstream (9/24) Detailed analysis is in the NPac Short Term Forecast above. In short, the jet is to start the Fall transition on Sun (9/27) perhaps influenced by El Nino, but nothing remarkable. This is disappointing, considering this is the ultimate determiner of how well El Nino is connected to the atmosphere in terms of influencing winter storm production. We suspect it is just a matter of time before it wakes up and responds.
Analysis: In late 2013 into 2014 the Active Phase of the MJO and successive Kelvin Waves warmed waters over the Eastern equatorial Pacific and primed the atmosphere out of a 15 year La Nina biased pattern that had been in.cgiay since the demise of the '97-98 Super El Nino. It is assumed some greater force was dictating the change from a cool regime to warmer pattern, (the PDO). This warming and teleconnection continued building in 2015 with two Kelvin Waves arriving in Ecuador warming surface waters well into El Nino territory and a third, the strongest so far, starting to erupt in the Galapagos region. At this time we believe the classic El Nino feedback/teleconnection loop is in effect, with the atmosphere and the ocean well co.cgied.
The 2015 El Nino pattern continues to build in fits and starts, but is hampered by 'The Pause' that occurred in August and continues in Nino1.2 today (9/10). In spite of that, El Nino continues to move forward. Temps in the Nino 3.4 region today are solid and expected to only build as the leading edge of massive Kelvin Wave starts erupt over the Galapagos. Still the focus of that eruption right now is west of the Galapagos. The big question remains concerning how strong will this El Nino become. In the end, strength is a function of the temperatures in the Nino3.4 region. The warmer the core temps and the larger their areal coverage, the more influence on the jetstream. Obtaining high Nino3.4 temps is a function of the strength and duration of westerly anomalies in the Kelvin Wave Generation Area. And the frequency of those events is dictated by the 'character' of the El Nino. The '97 event was a bulldozer, developing out of a previous cold La Nina water state, and never looked back. Contrasting that was the '82-83 event, which didn't even start presenting until the Fall. The 2015 event presented originally with a false start in 2014 (and for that matter another false start in 2012), and has taken it's sweet time getting organized since then, in fit's and starts. We suspect it is struggling against an atmospheric biased towards La Nina forced by a 15 year run of the cool phase of the PDO. But we believe the atmosphere is now transitioning to the warm phase of the PDO, but is still fighting some previous momentum from the cool phase, hence elongating this El Nino's lifecycle. Regardless, a large and strong Kelvin Wave, the largest of this event is starting to erupt now. It will take at least 3 months for the tail end to erupt over the Galapagos and advect through the Nino 3.4 region. So assuming peak heating in Nino1.2 occurs on 10/4, it will be 11/4 till that peak warmth reaches Nino3.4. And that might even be optimistic.
Comparing the 2015 El Nino to '82 and '97
(Click to enlarge)
The longer El Nino threshold temperatures persist, the thought is the
longer it will take proportionally to dissipate. That is, the sooner
warm water temps develop, the sooner they will have an effect on the
atmosphere and the more momentum El Nino will have on the atmosphere,
and will therefore take longer to dislodge. The atmosphere responds
very slowly to change. but once changed, it doesn't turn back to it's
previous configuration quick either. An official El Nino was declared
in late 2014 and has only gotten stronger since then. If westerly
anomalies continue as predicted by
the CFS model, and another Kelvin Wave results (starting say 11/1), it
would not
arrive in Ecuador till ~Feb 1, 2016, and not disburse till a month
later (March) that would mean a total duration of El Nino temps in the
Nino3.4 region of 17 months. That said, the character of this event is not at all like '97 (which was brisk paced and steady), but not at all like '82 either (which developed even later and faster). This one is a slow moving train wreck. That would not be a bad thing, in that it could slow the inevitable transition to La Nina until later in the winter of 2016-2107.
So where does it go from here? Having a MEI (July & Aug) that is equivalent to two other El Nino that eventually turned into Super El Ninos is no guarantee that this years event will eventually evolve into a Super El Nino. We still have 0.63 SDs to go. But given the current warming in the west quadrant of Nino1.2 now, that seems like a pretty easily obtainable goal. And looking at the record back to 1950 for other events that have similar values in July & Aug, the odds favor that outcome. With an evolving El Nino base state in control and building, it seem more warm water transport east is inevitable. And we haven't even hit the Fall season switchover, which tends to supercharge westerly anomalies during El Nino years. The future concerning more and stronger WWBs is unknown, but we are betting on the CFSv2 being largely on the right track with the El Nino base state slowly having greater influence over time and being enhanced by Rossby Waves at times.
So for now we're tracking towards an El Nino that will end up somewhere between the 82' and '97 event, with very good atmospheric momentum in.cgiay. We'll continue monitoring the North Pacific jetstream and will be looking for tropical activity in the West Pacific to recurve northeast moving towards the Gulf of Alaska, and for swell to result from such systems in Sept. To us, those are the sure signs of deep changes in the atmosphere influenced by El Nino. Typhoon Atsani did not live up to the hype. And Kilo is not going to do it either. And the jetstream charts are not impressive. All data to date regarding the character of this years event, depict it as a slow mover. As such, any direct influence from El Nino will probably occur alter in the Fall rather than earlier. Regardless, continue your training routine.Once the storm cycle starts, we expect it to only build in momentum, consistency, and intensity, peaking in the Feb timeframe.
See imagery in the ENSO Powertool
****
External Reference Material: El Nino Southern Oscillation (ENSO), Madden Julian Oscillation (MJO), Pacific Decadal Oscillation (PDO), Southern Oscillation Index (SOI), Kelvin Wave
Add a STORMSURF Buoy Forecast to your Google Homepage. Click Here:

Then open your Google homepage, hit 'edit' button (top right near graph), and select your location
Local Interest
Updated - Stormsurf Video Surf Forecast for the week starting Sunday (9/20): https://www.youtube.com/watch?v=rmP_nUogxxo&feature=youtu.be&hd=1
For automatic notification of forecast updates, subscribe to the Stormsurf001 YouTube channel - just click the 'Subscribe' button below the video. - - -
- - -
 |
Casa Noble Tequila If you are looking for an exquisite experience in fine tequila tasting, one we highly recommend, try Case Noble. Consistently rated the best tequila when compared to any other. Available at BevMo (in California). Read more here: http://www.casanoble.com/ |
Mavericks Invitational Pieces Featuring Stormsurf:
http://www.bloomberg.com/video/how-to-predict-the-best-surfing-waves-EsNiR~0xR5yXGOlOq2MqfA.html
http://www.cbsnews.com/videos/surfs-up-for-mavericks-invitational-in-calif/
Time Zone Converter By popular demand we've built and easy to use time convert that transposes GMT time to whatever time zone you are located. It's ion left hand column on every page on the site near the link to the swell calculator.
Stormsurf Google Gadget - Want Stormsurf content on your Google Homepage? It's si.cgie and free. If you have Google set as your default Internet E.cgiorer Homepage, just click the link below and a buoy forecast will be added to your Google homepage. Defaults to Half Moon Bay CA. If you want to select a different location, just click on the word 'edit', and a list of alternate available locations appears. Pick the one of your choice. Content updates 4 times daily. A great way to see what waves are coming your way!
http://www.google.com/ig/add?moduleurl=http://www.stormsurf.com/gadget/stormsurf .xml
Free Stormsurf Stickers - Get your free stickers! - More details Here
Read all the latest news and happenings on our News Page here
Surf Height-Swell Height Correlation Table